An introduction to the Brain Gauge scoring system
In the ProTools (or RxTools) app, your Brain Gauge metrics reflect how your brain performance compares to population averages. If you have a score of 100 for any metric, you performed as good as (or better than) healthy controls from our subject population. We calculated the mean scores for our tests through years of clinical trials.
On the other hand, if you have a low Brain Gauge score (between 0 and 70), you scored poorly on that metric's tests compared to our subject population. However, a score of 0 does not mean that you scored worse than everyone else - your performance was just significantly lower than the population average. To see exactly how you performed, you can check out your Raw results on the score analysis screen. This allows you to track results that are far above or below the mean.
For example, a person with a Reaction Time (RT) of 600 msec will receive a 0 score for Speed. Although this is considered a "poor" score that is far outside the normal range, it is not uncommon for people with concussions to perform at this level. That individual may test every 2-3 days, and though their Speed score will remain at zero, they may have RTs that improve from 600 to 500, 400, 300, 200, etc. Once below 300 their score will rise above 0.
Now let’s consider an example on the other end of the scale. Suppose someone with an initial RT of 200 msec begins experimenting with nootropics or nutritional supplements. Over time, their RT may drop from 200 to 190, 170 and even 160 as they're brain health improves, but all of those scores will register a Speed score of 100. The only way to detect improvement is through monitoring the raw reaction times.
Note that for all the raw metrics (e.g. RT, reaction time variability (RTVar), amplitude discrimination) lower values indicate stronger performance. A lower RT will cause the Speed metric to increase.
How do my scores compare to everyone else?
The data plots below display scores from all Brain Gauge users. We've collaborated with numerous researchers who collect data on a wide range of neurological disorders, so the values below do not represent normal distributions. For example, there are results from many concussion studies included in these graphs. An individual in one of those studies will test periodically between days 1-21 post-concussion, but their scores will not be in healthy range until around day 14 or even later. Once they are cleared to return to play, subjects rarely continue testing.
The data has been grouped into percentiles: top 10%, next 10%, etc.
Note that the exact values reported here may change with future updates, but the overall trends will remain the same.
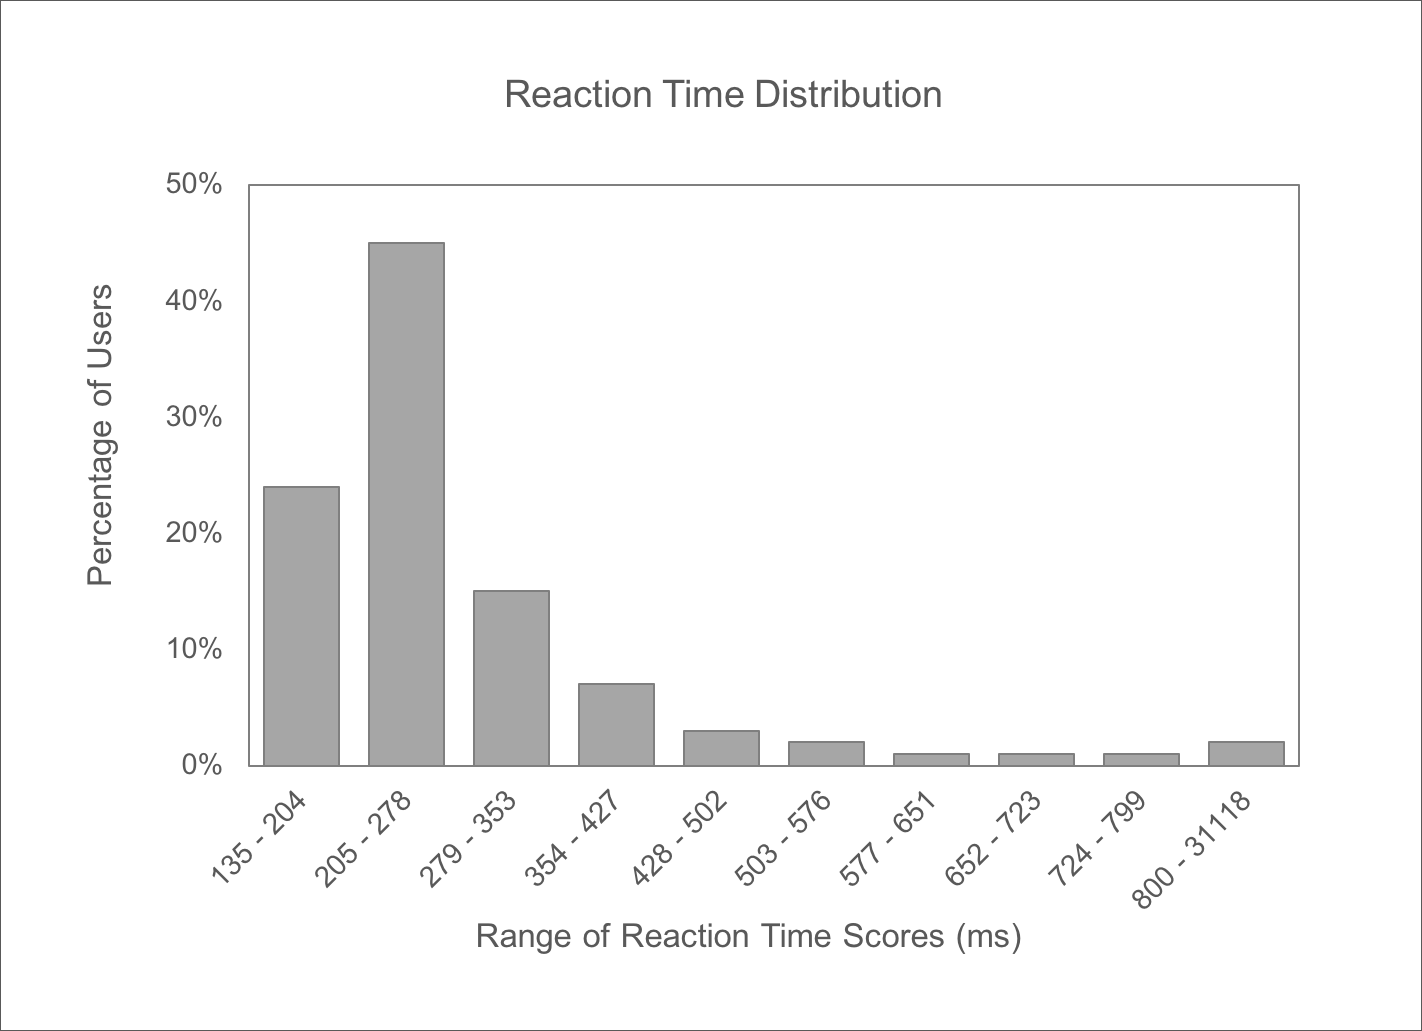
The above graph shows reaction times from all Brain Gauge users. Most people have a reaction time between 119 and 333 milliseconds (msec).
You can also compare scores to the normative data that was collected only from healthy controls:
Simple Reaction Time (RT) is a test that measures how quickly your brain reacts to stimulation. The reaction time test is used to calculate your Speed, Focus and Fatigue scores.
top 10% : 185 msec or faster
top 25% : 202 msec or faster
50% percentile : 223 msec
bottom 25%: 244 or slower
bottom 10%: 267 or slower
Reaction Time variability (RTvar) is a measure of the consistency of your reaction time trials. RTvar is used to calculate the Focus and Fatigue scores.
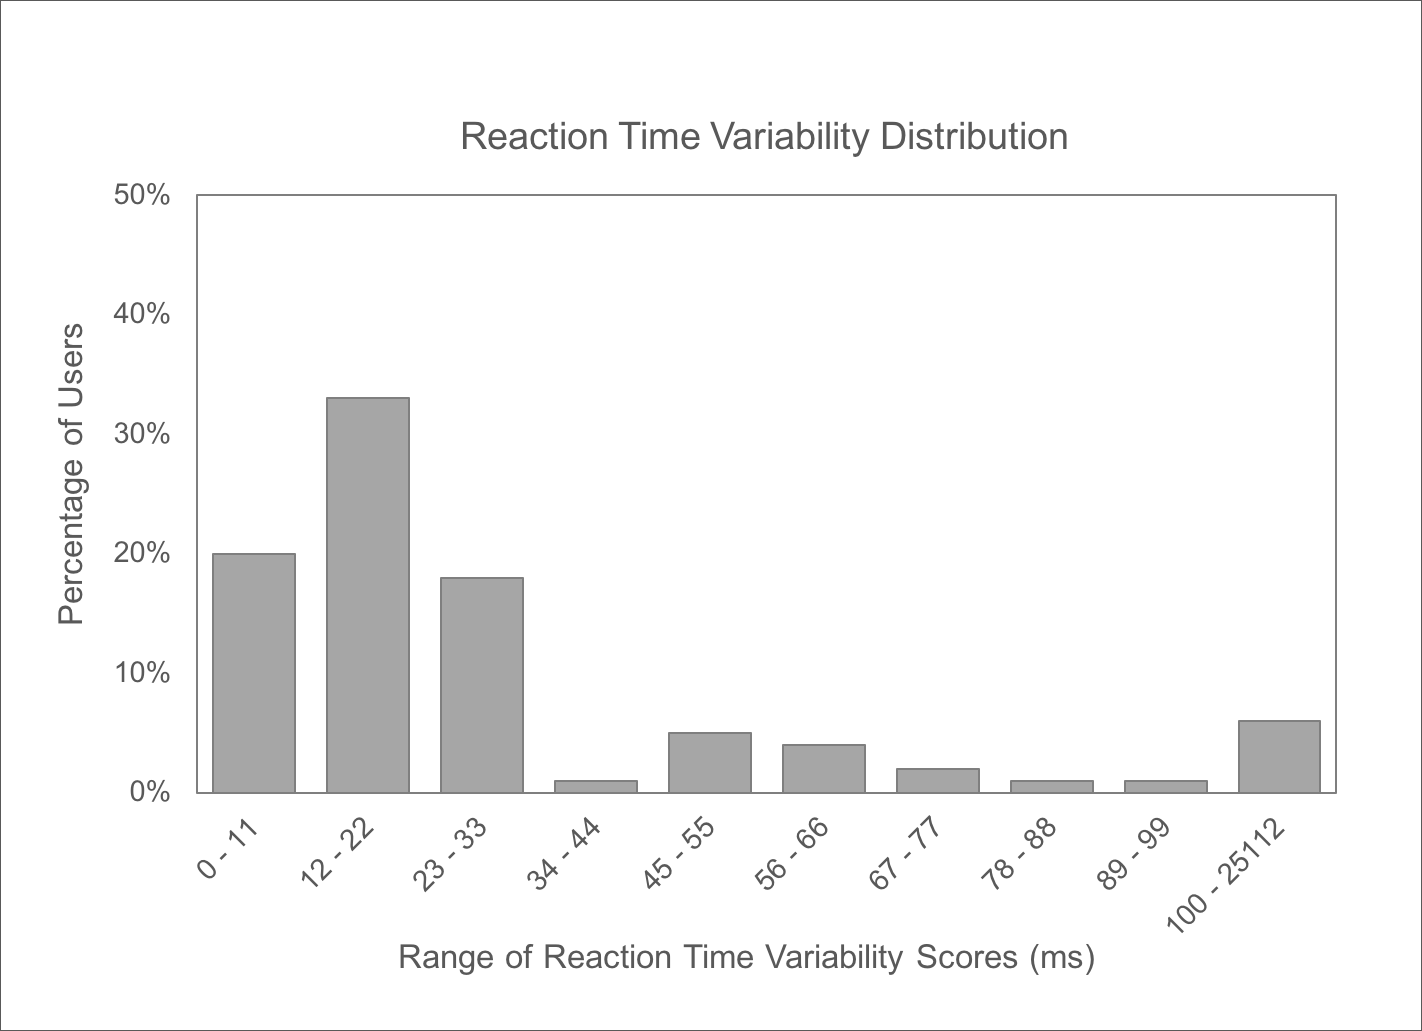
Best possible score: 0 msec (identical reaction times across all trials in a testing session)
Top 10% : 9 msec or lower
Top 25% : 13 msec or lower
50% percentile : 17 msec
Bottom 25% : 26 msec or greater
Bottom 10% : 35 msec or greater
Temporal Order Judgement (TOJ) is a measure of your ability to determine the order of two events. TOJ values are used to calculate your Sequencing score.
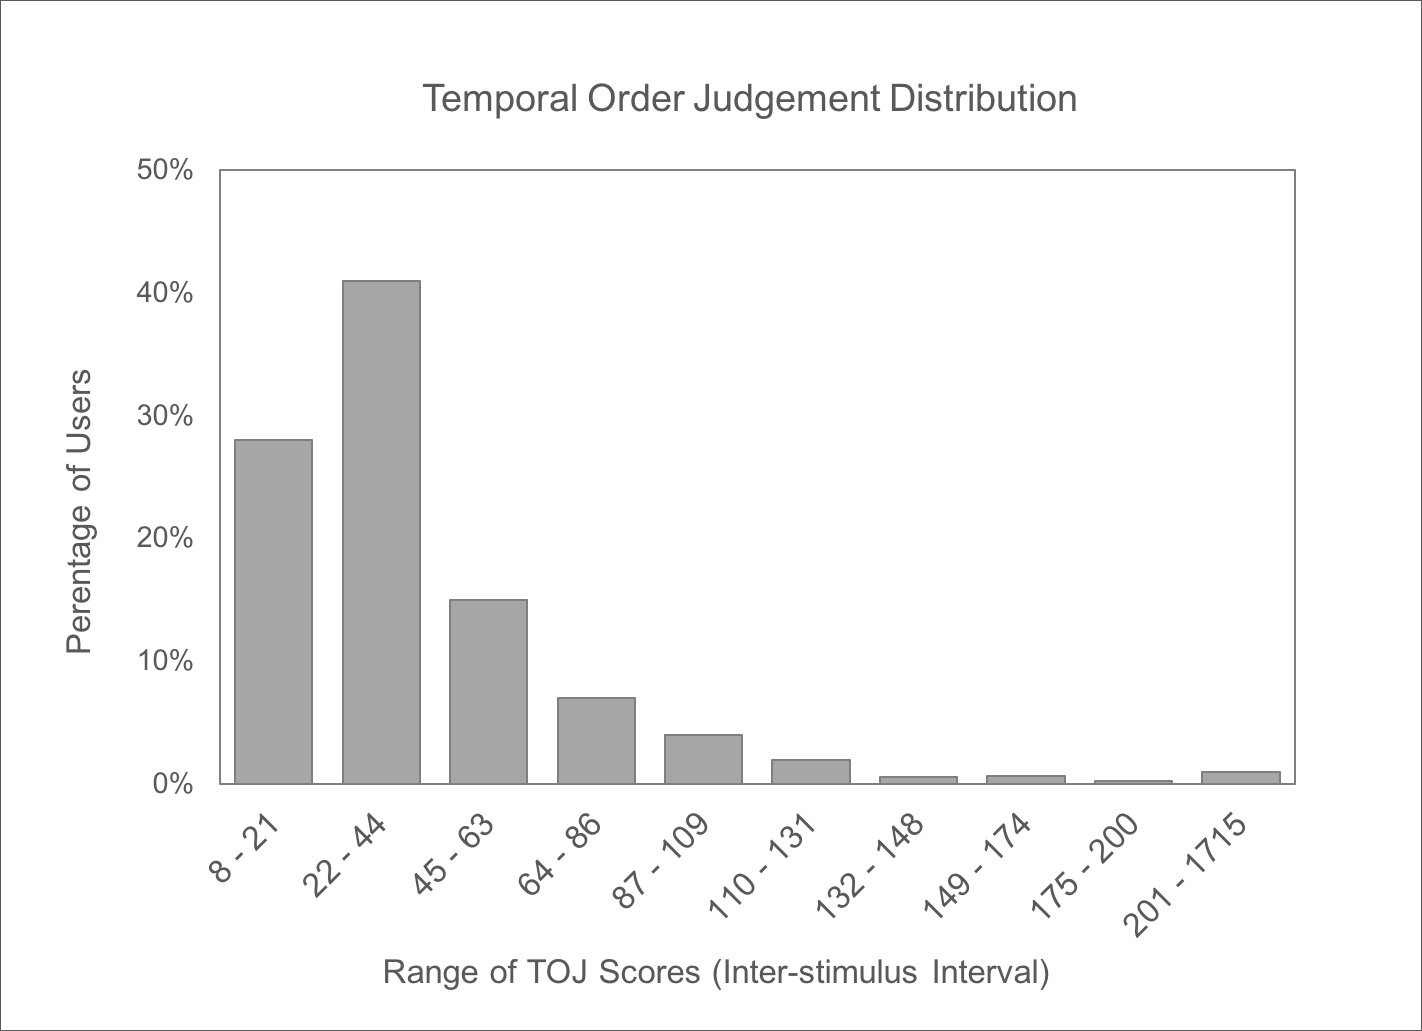
Top 10% : 25 msec or lower
Top 25% : 33 msec or lower
Duration Discrimination Challenge is a measure of your brain's ability to determine the duration of events. This test is used to calculate your Timing Perception score.
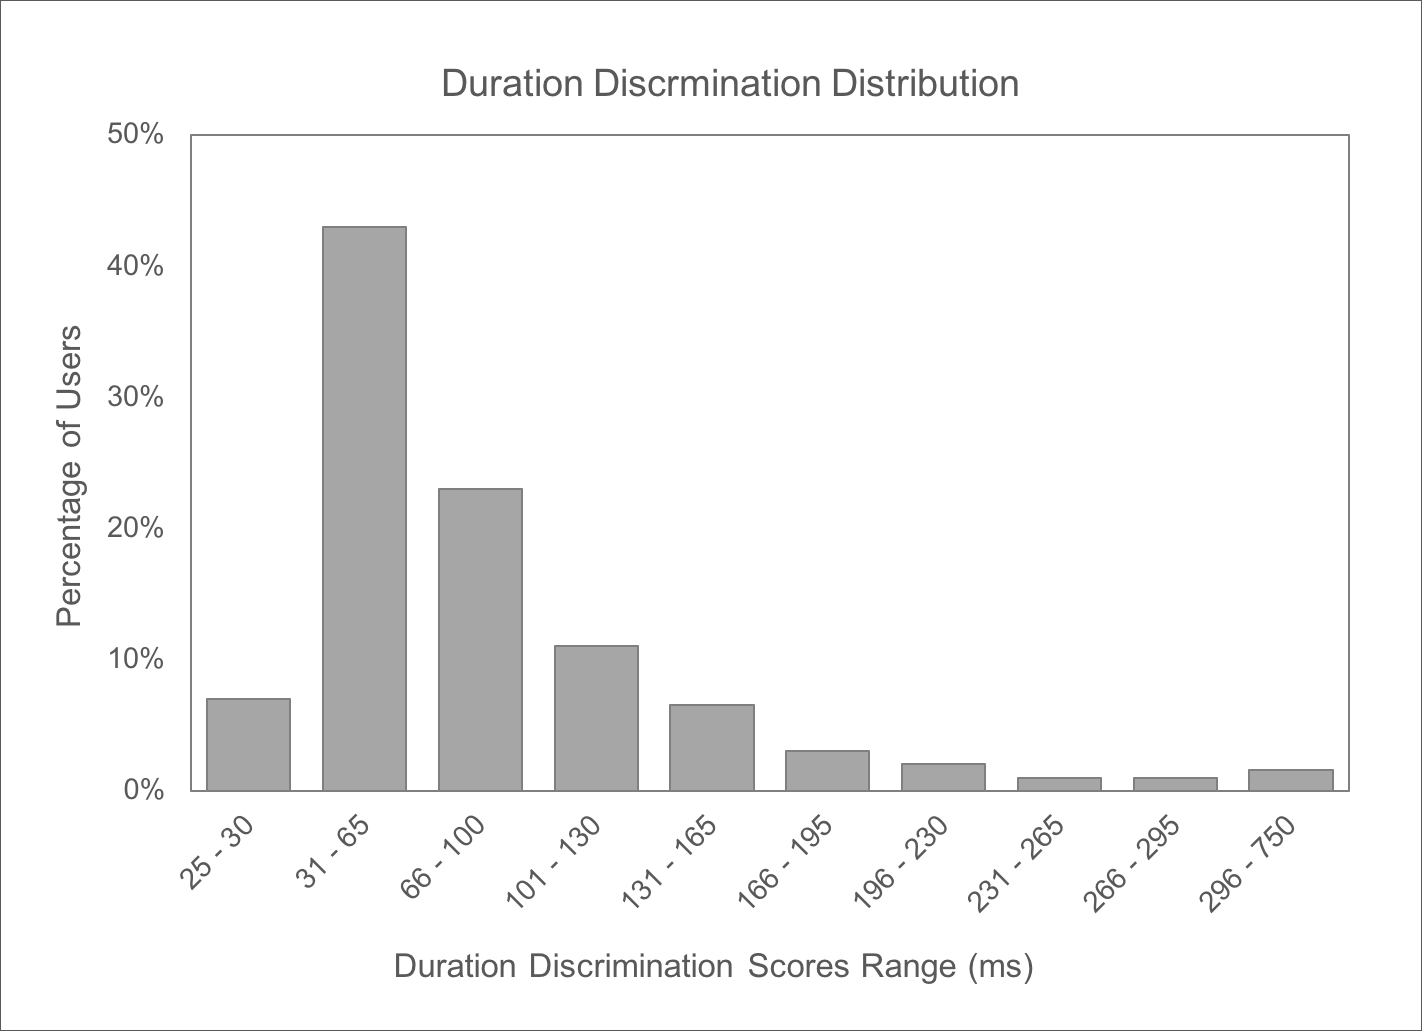
Best possible score : 25 msec
Top 10% : 40 msec or lower
Top 25% : 50 msec or lower
Sequential Amplitude Discrimination is a test that is used to calculate your Accuracy and Plasticity scores.
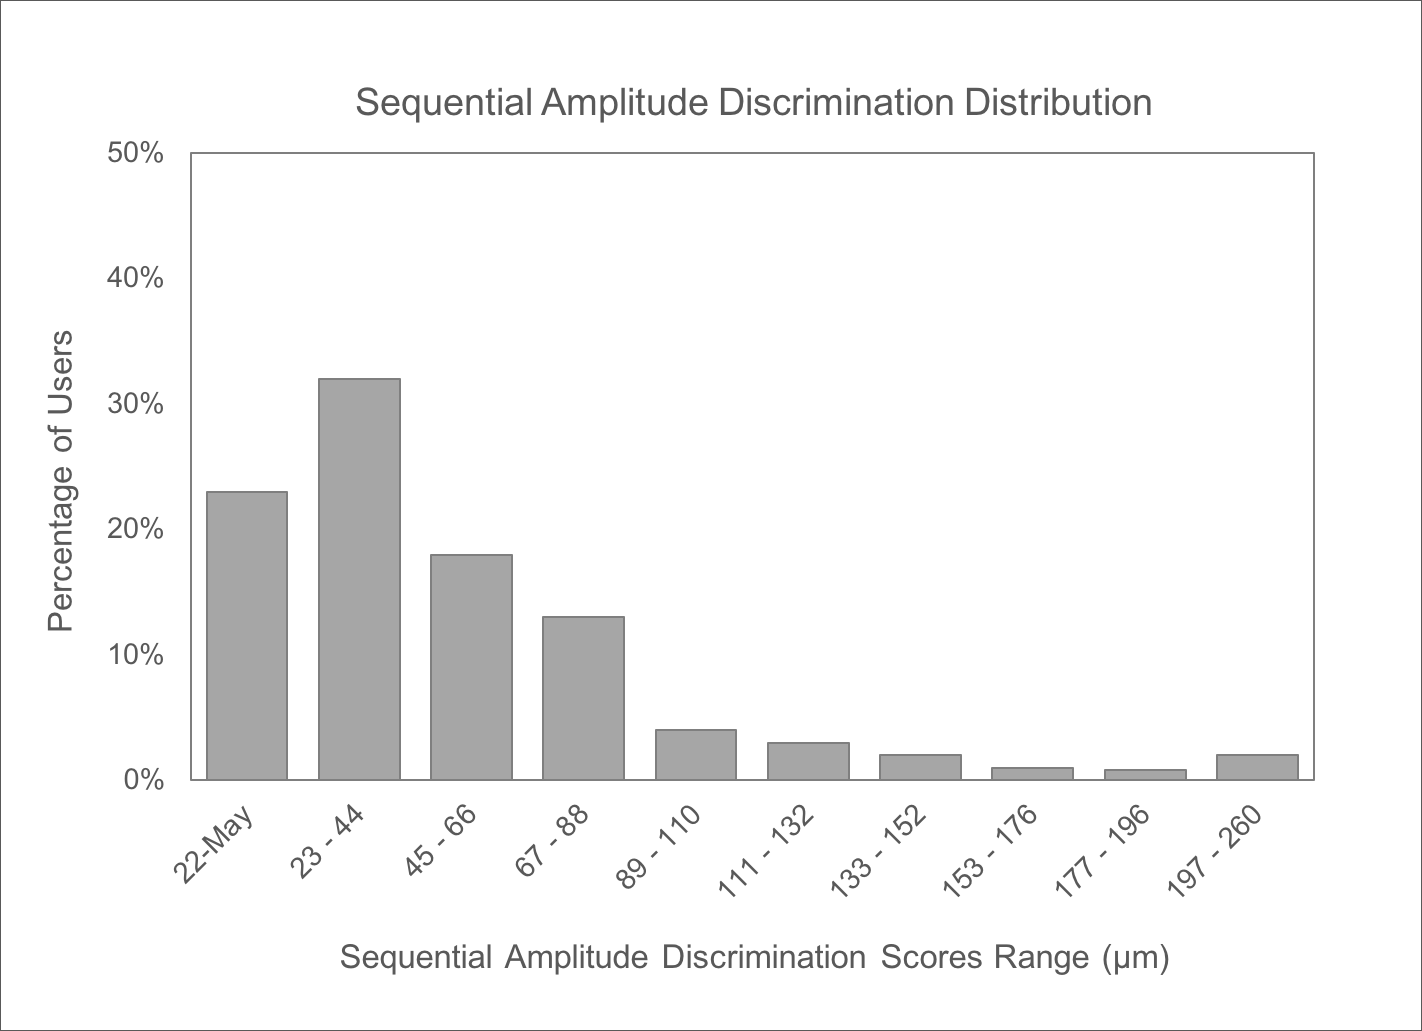
Best possible score : 5 msec
Top 10% : 20 msec or lower
Top 25% : 38 msec or lower
Simultaneous Amplitude Discrimination is also used to calculate your Accuracy and Plasticity scores.
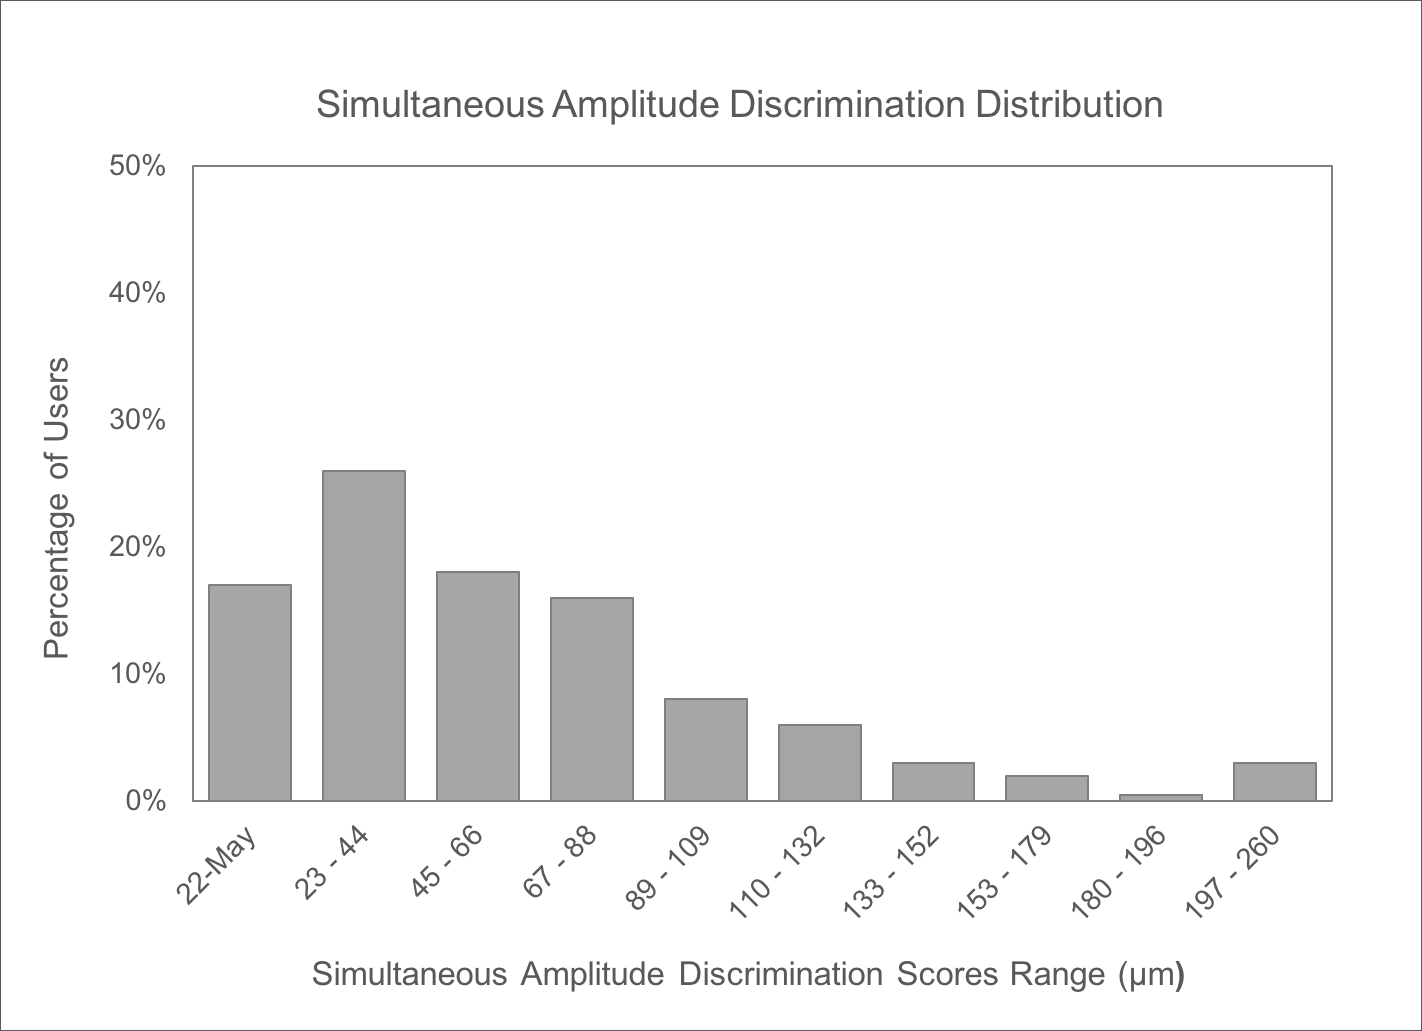
Best possible score : 5 msec
Top 10% : 20 msec or lower
Top 25% : 30 msec or lower