An introduction to the scoring system used in the Brain Gauge App.
The results are in! With over 2000 subjects in our concussion study, we have some pretty solid results for you to compare with. The below table shows each individual Brain Gauge measure with the corresponding raw score values for predicted healthy subjects, healthy average subjects, and concussed subjects.
If you are interested in learning more about each individual metric and where it comes from, you can look at the "What Do My Scores Mean?" handout.
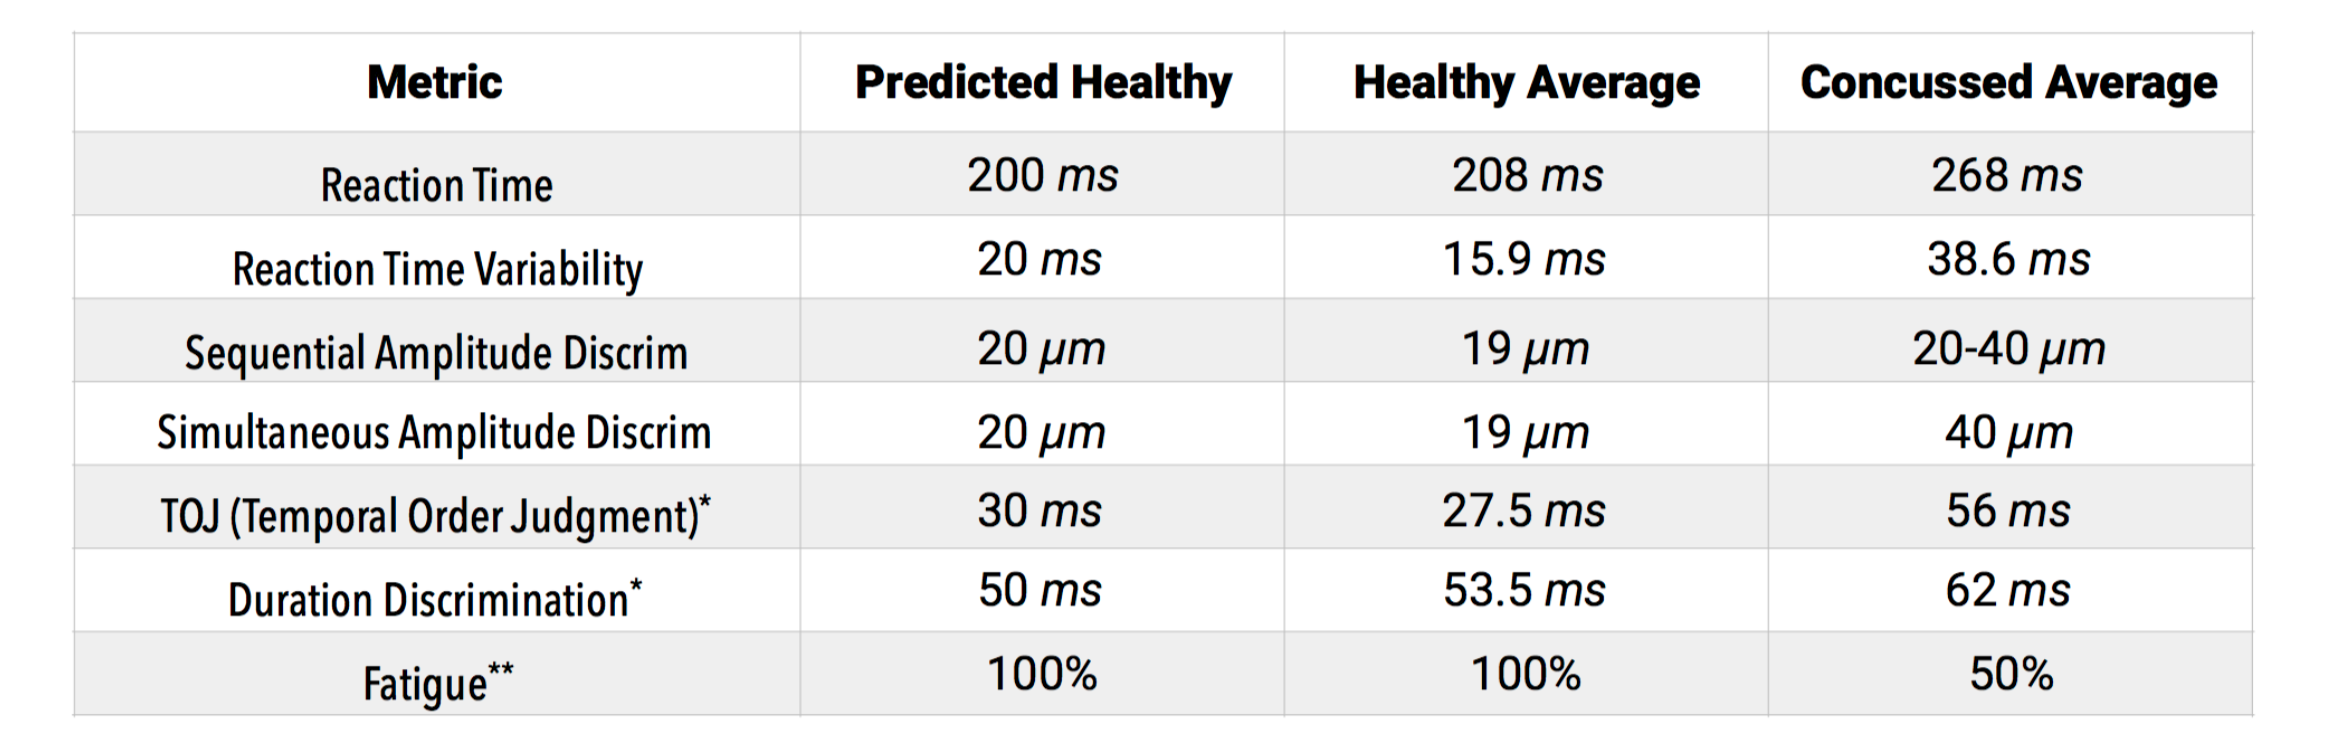
**The Fatigue metric is computed and correlates well with standardized clinical assessments of fatigue that rely on questionnaires.
*TOJ and DD are dependent on location of trauma. TOJ is more likely to deviate from the norm with front of head injury and DD is more likely to deviate with back of head injury. In other words, insult to the front of the head may result in a TOJ score >> 40, and insult to back of the head may result in a timing perception (DD) score >> 60.
Who would benefit from baseline?
For approximately 93% of all users, the normative averages above work. Currently, these metrics have only a 7% error (other methods are in the 30-50% range).
Super-testers comprise about 3% of the population. They will typically outperform everyone else, no matter what. For example, the best score to date for RT is well below 130.
Super-bad testers comprise about 3-5% of the population. They test extremely poorly because they either do not comply (i.e. no effort) or they have some other neurological insult (significant concussion history, severe ADHD, substance abuse).
Time dependent testing
Early and quick testing on Days 0-1. A quick, 2-3 minute test on Day 0 or Day 1 post-concussion will provide you with a pretty good metric to initially assess the impact of a concussion on an athlete. Simply do the first reaction time test (first test in the battery). If RTvar (reaction time variability) is well over 20 msec (i.e., closer to 40 than to 20), then there is a 93% chance that the subject is concussed.
Follow up testing on Day 3 post-concussion or later takes 15-20 minutes. If you are trying to assess full recovery, have your athlete take the full battery and compare all results to the above chart. The larger the number of tests that they are symptom free on (i.e., tests that are within normative range), the more likely they are ready to return to play.
Radar plots will often look something like this during the return to play progression:
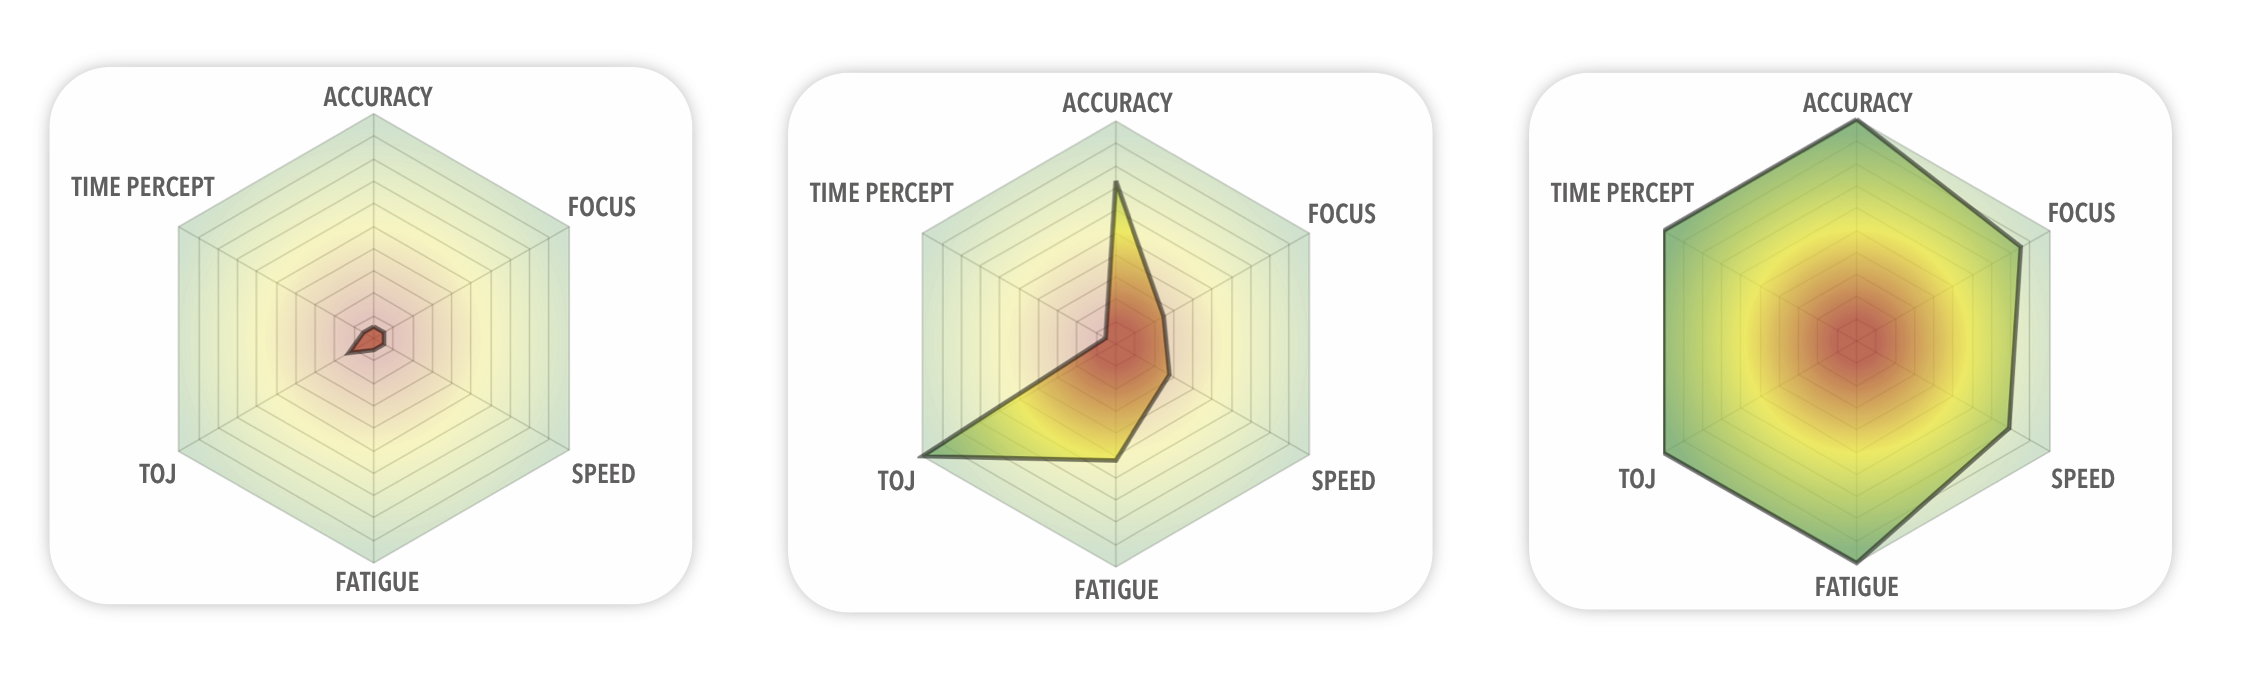
Note that when scores return to higher values, the chart gets more “filled”. Full scale on the radar plot indicates that values on that vector are in normative range.
You can download a pdf of this issue here.