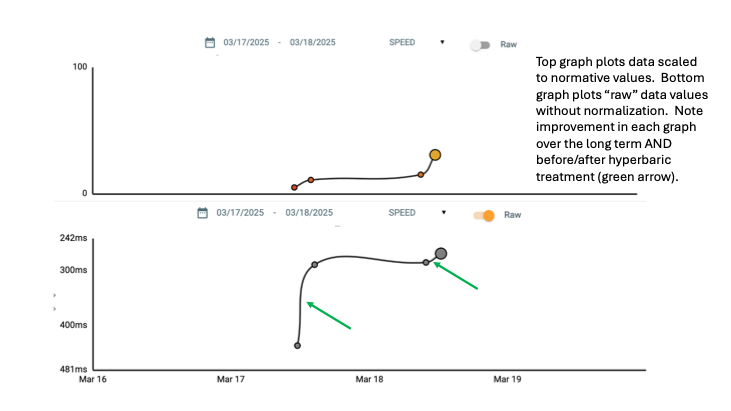
One new feature of the Brain Gauge analysis app is to take a closer look at the raw scores. Raw scores simply are not normalized. This means that if data is outside the range of normative values, you might not see the degree of improvement that has occurred with treatments and/or brain training. The graphs below demonstrate the new feature as well as a sample case study of an individual receiving hyperbaric treatment. Note the position of the "Raw" switch in the image: the top graph shows normative values for speed (reaction time) and the bottom graph plots raw values. In both cases, you can see improvement. However, the bottom plot is much better at demonstrating the extent to which improvement was made, simply because the early results were so poor (and well outside the normative range). Both graphs demonstrate improvement with hyperbarics both short term (before and after hyperbarics) and long term.
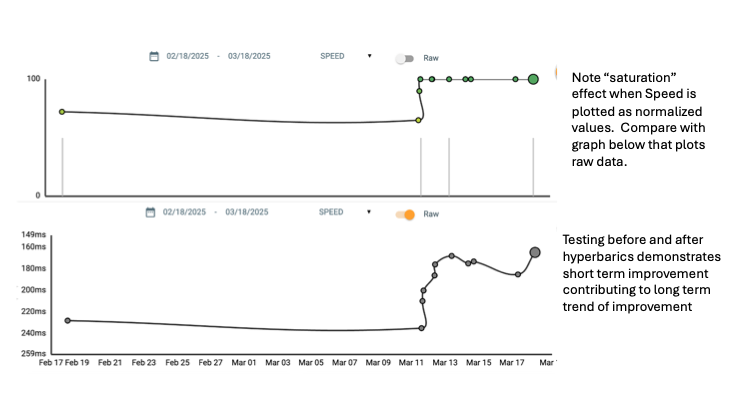
The next set of graphs is a good example of data outside the normative range on the positive side. In this case, the individual started out slightly below the normative range but with treatment and training has reached "elite" levels of peroformance. Note that the top graph is fairly insensitive to improvements while the bottom graph, which plots the raw data, clearly shows significant improvement. Vertical lines indicate when brain training with the Brain Gauge took place. Looks like hyperbarics coupled with brain training with the Brain Gauge clearly pays off!
Interested in seeing how well treatments and/or brain training with the Brain Gauge works? Check out www.corticalmetrics.com or learn more on the Brain Gauge YouTube channel.
Interested in learning more about hyperbarics? The data above came courtesy of Okoboji Wellness Clinic, Spirit Lake Iowa. Find out more at okobojiwellnessclinic.com