Brain Gauge Origins
My first real exposure to neuroscience was in the early 1980s (I say real because I don’t count textbook and classroom exposure). After graduating with an MS in Biomedical Engineering and Mathematics, I was hired as an in-house engineer in a neurophysiological lab. In addition to developing and maintaining experimental protocols for this lab, we were also the “hub” for a multiple investigator group that was studying pain (that program project started in the 1980s and continued for 30+ years). Several different methods were used to study pain by that project – animal studies, human EEG studies, human sensory perceptual studies and clinical studies. One of the objectives was to gain a better understanding of the underlying neurophysiological mechanisms of pain and develop better ways to measure or quantify it. My personal observations at the time (many of which I still hold today) were that some of the methods were extremely crude – particularly for measuring the level of pain in chronic pain patients. One standard method was to deliver noxious (painful) stimuli to pain patients and ask them how much it hurt (unfortunately, a lot of things have not advanced and this method is still used by quite a few clinical researchers). I started thinking that there had to be a better way to quantify the impact that pain had on the brain function of pain patients (i.e., without a painful stimulus).
In parallel to those observations, I was deeply immersed in studying patterns of cortical response to tactile stimulation. We were vibrating the skin and using high resolution imaging to detect changes in patterns of brain function. I became fascinated with these patterns and how reproducible that they were from subject to subject – and that they were not reproducible if brain function was altered pharmacologically or surgically. Could we use this information to develop a non-invasive measure of brain health? With the papers we were publishing, I naively thought that someone would notice and build something like the Brain Gauge. Made sense to me – our high-resolution measures of neurophysiological function in non-human primates corresponded with sensory perceptual measures of human subjects. After kicking that idea around for about a decade, Bob Dennis moved his lab from the University of Michigan to University of North Carolina. That lab was, coincidentally, across the hall. We spent many afternoons doing chalk talks about the science that we were doing and the engineering that we needed to do in order to make something like the Brain Gauge. Eventually, I wore him down and he spent a weekend throwing together something that worked out of fishing wire and plastic. Definitely not ready for prime time, but it worked and we started running experiments that not only achieved proof of concept, but got us enough data to get funding to develop cortical metrics (what we called the measures, since they corresponded to measures of cortical function as opposed to skin based measures, which many researchers were focused on at the time). Since our pilot study data was from autism, autism was our first funded research for a given neurological disorder. We subsequently got funding for studying pain and it was only much later that we started our studies in mTBI or concussion. Along the way, we conducted additional studies on aging, pharmacological interactions, alcoholism and degenerative disorders.
Serendipity played an enormous role in the Brain Gauge development. I’m ok with that – I would much rather be lucky than good. First, there was Bob moving across the hall at the same time that we started doing sensory perception experiments. Then there were several students that ended up in my lab – all easily the best students in the department but were “looking for something interesting to do” and as they put it, no one else in the department at the time had anything going on that interested them. We were always looking for new applications of the method, and one of the obvious ones was concussion – but no one seemed interested in using a new method. However, the athletic trainers at Davidson College (Beth Hayford and Brian Wheeler) were pretty eager to deploy something that actually worked and did not mind giving us a chance. Data from that site was instrumental in getting to the next step, which was the real catalyst for getting the science out of the lab and into the field as a product. That next step was a chance phone call between myself and Dr. Laila Zai in 2012. At the time, Laila was the assistant to a program manager at the Office of Naval Research (Dr. Tim Bentley) and when we first spoke, I am pretty sure she thought I was just another geeky academic with some crazy idea. But after we started talking, she immediately grasped what the potential of the method was and decided it was worth looking at a little closer. More conversations followed with her and Dr. Bentley, and the support that we received from the ONR made it possible to develop the product. The ONR deserves the lions share of the credit (and hopefully not the blame) for the development of the Brain Gauge over the past few years. I try not to depend on being lucky, but looking back, it played a pretty big role in where we are today.
3.1 Pictorial history of the technology
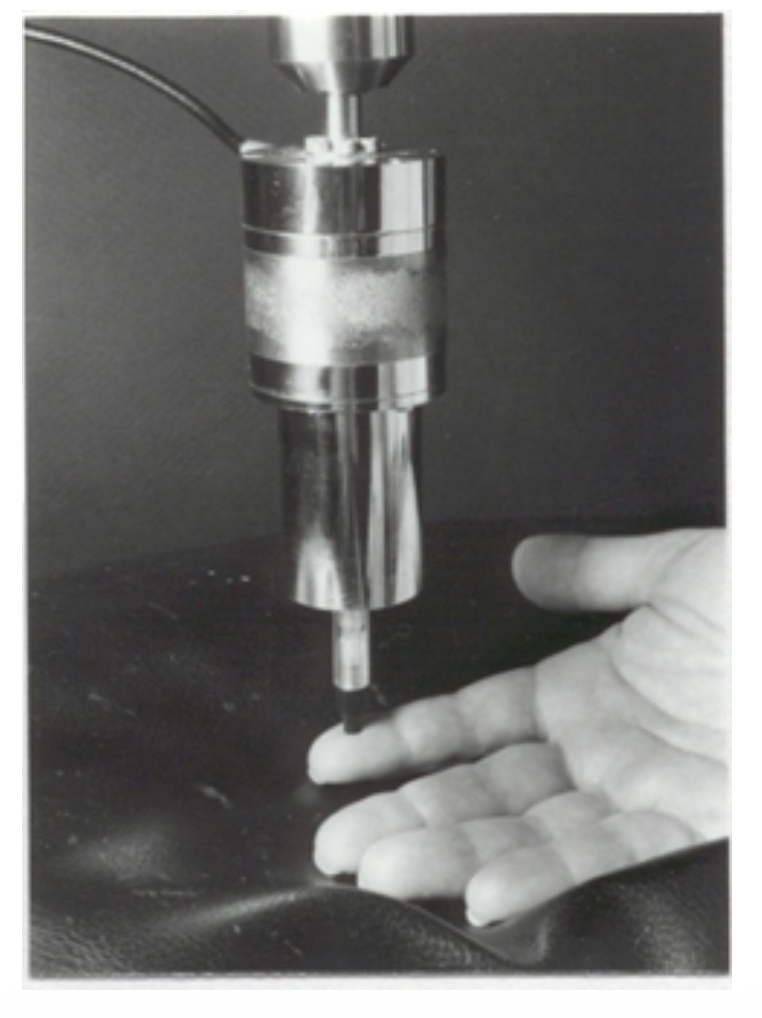
- The “Chubbuck”. The standard stimulator for brain research that was used to compare human perceptual responses to skin stimulation with neurophysiological responses obtained from both human and animal studies. Thousands of papers that utilized this technology were published over the next 50 years demonstrated multiple mechanisms of CNS information processing but NONE of the methods utilizing this approach were ever translated into a successful practical application. One reason for this is that with associated stand and electronics it weighed in at well over 100 lbs.
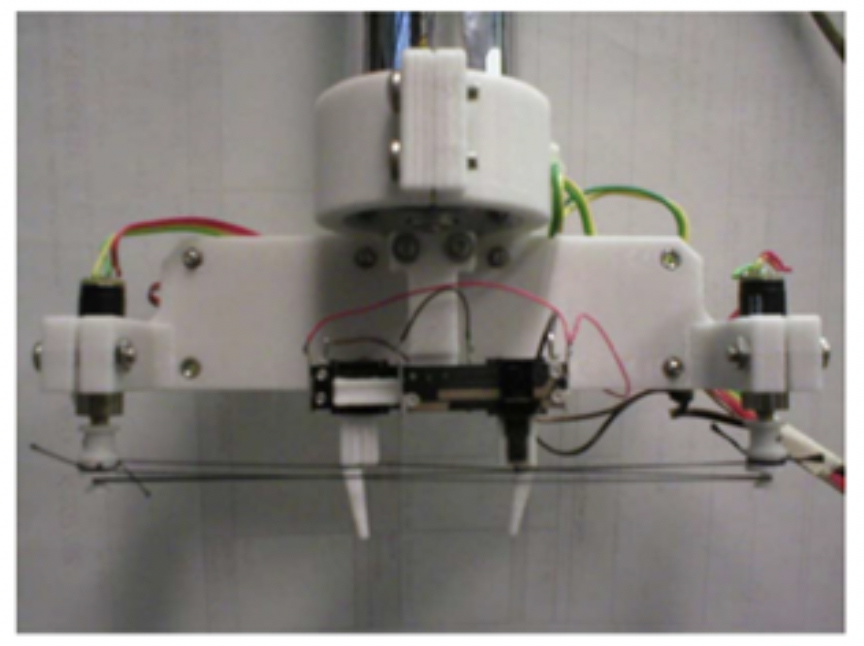
- First Cortical Metrics Prototype (the TPPOS). The TPPOS achieved proof of concept that simultaneously delivering stimuli to two skin sites led to perceptual changes that could only be accounted for by interactions that could only occur centrally (in the cortex). The term “cortical metrics” was used to describe the perceptual measures obtained that resulted from dynamic cortical-cortical interactions evoked by the TPPOS. TP stands for “two-point”. You can probably figure out how we affectionately came up with the “POS” acronym.
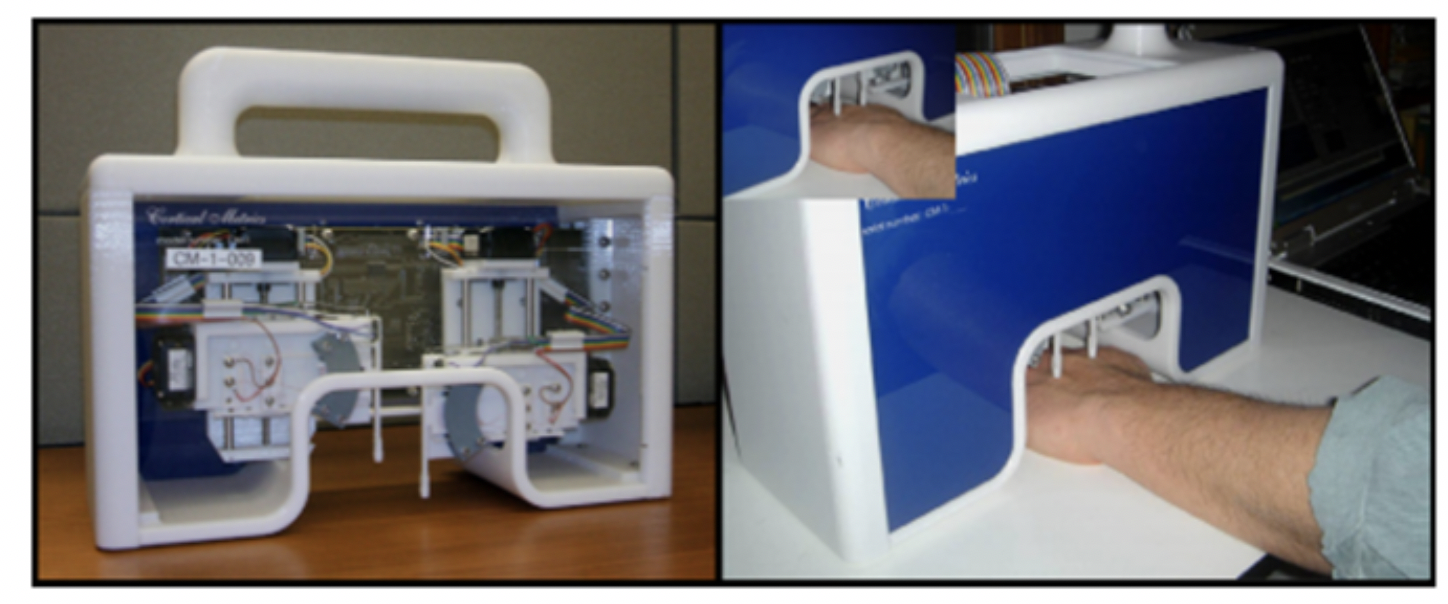
- The CM-1. The world’s first truly portable two point tactile stimulator was used to demonstrate that neurological function fit form: changes in cortical metrics could be linked to alterations in anatomy and physiology. Weighed in at 15 lbs.
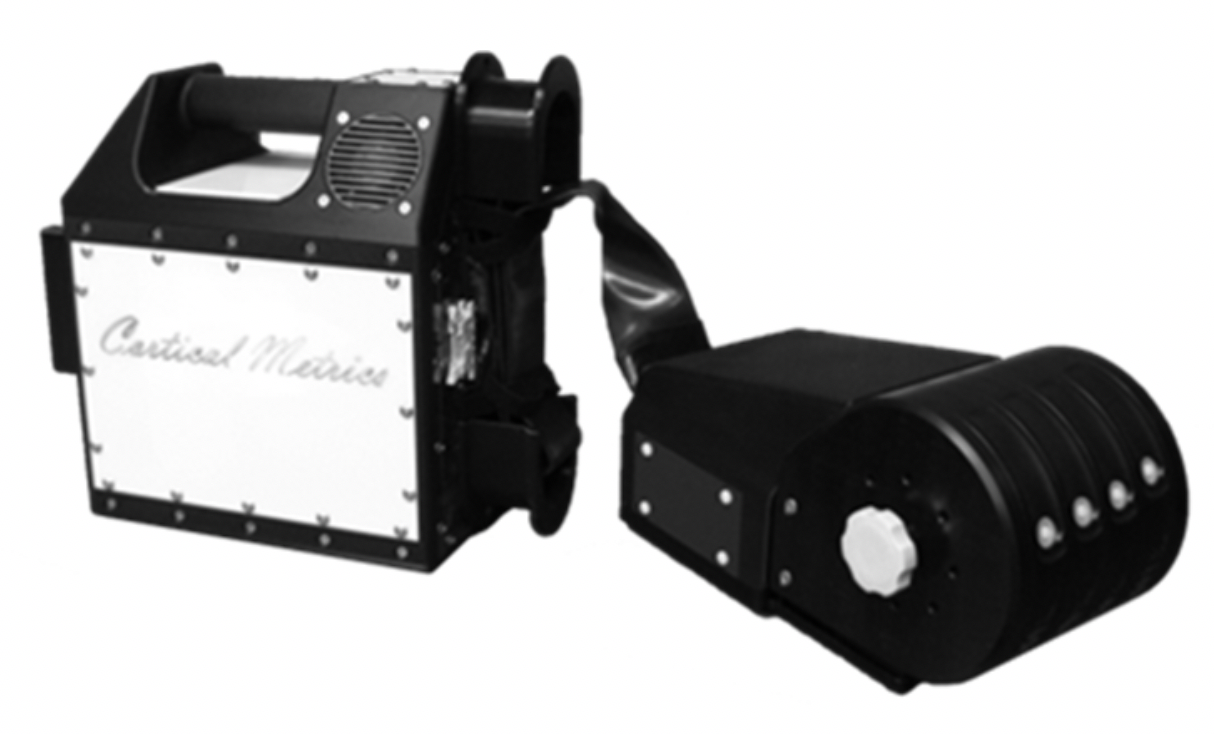
- The CM-4. Electronics of the CM-1 were moved to independent housing to allow for a smaller footprint on the desktop. Much more portable at 8 lbs and the device became adopted by a number of labs around the globe for a wide spectrum of neurological studies including concussion/TBI, autism, chronic pain and aging.
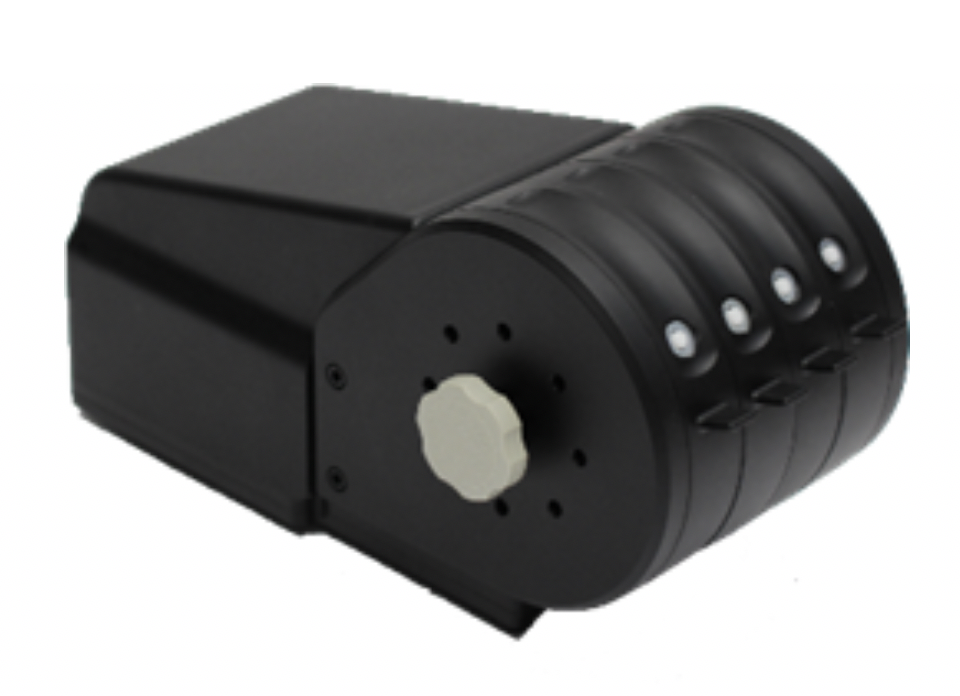
- The CM-6. The electronics of the CM-4 were miniaturized and placed inside the arm-rest. Now weighing less than 2 lbs, the Brain Gauge Pro could more easily be placed in a large number of basic and clinical research environments, and the number of research study sites expanded significantly.
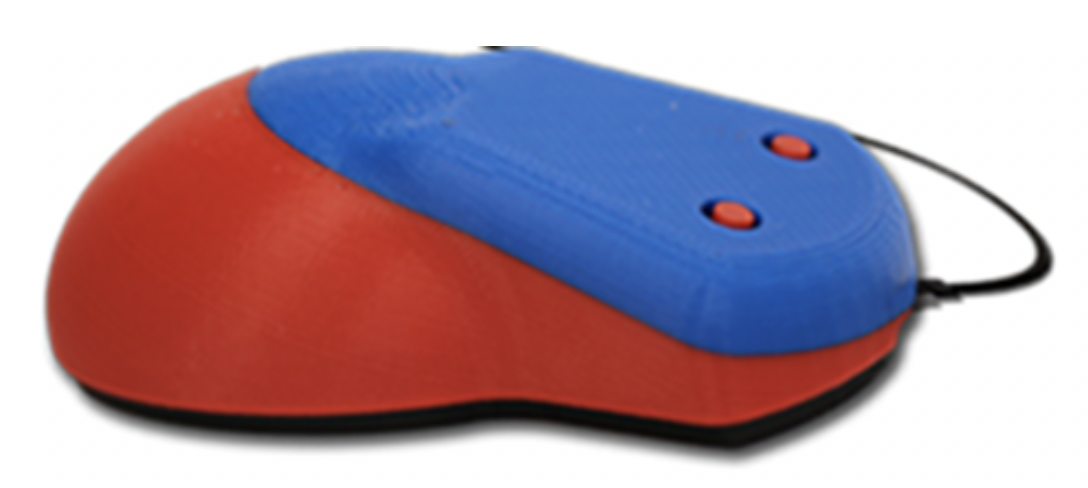
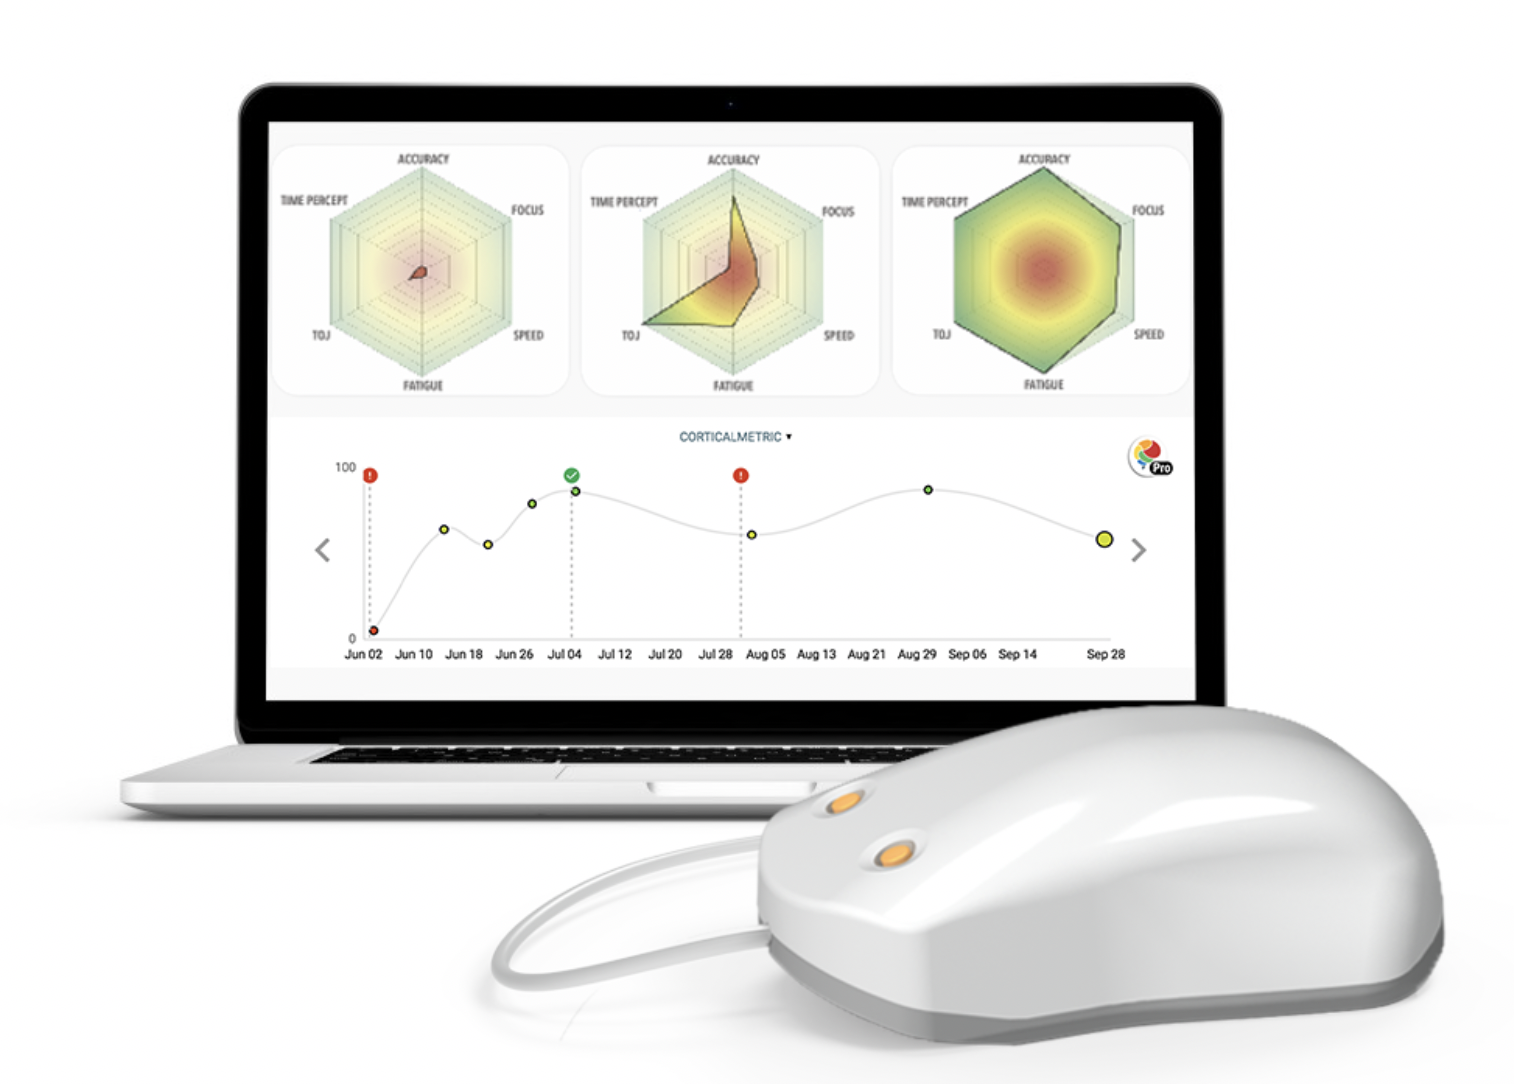
- The Brain Gauge. Further miniaturization led to the computer-mouse sized device. Only requiring a USB connection, this device can be easily distributed to a wide variety of end users.
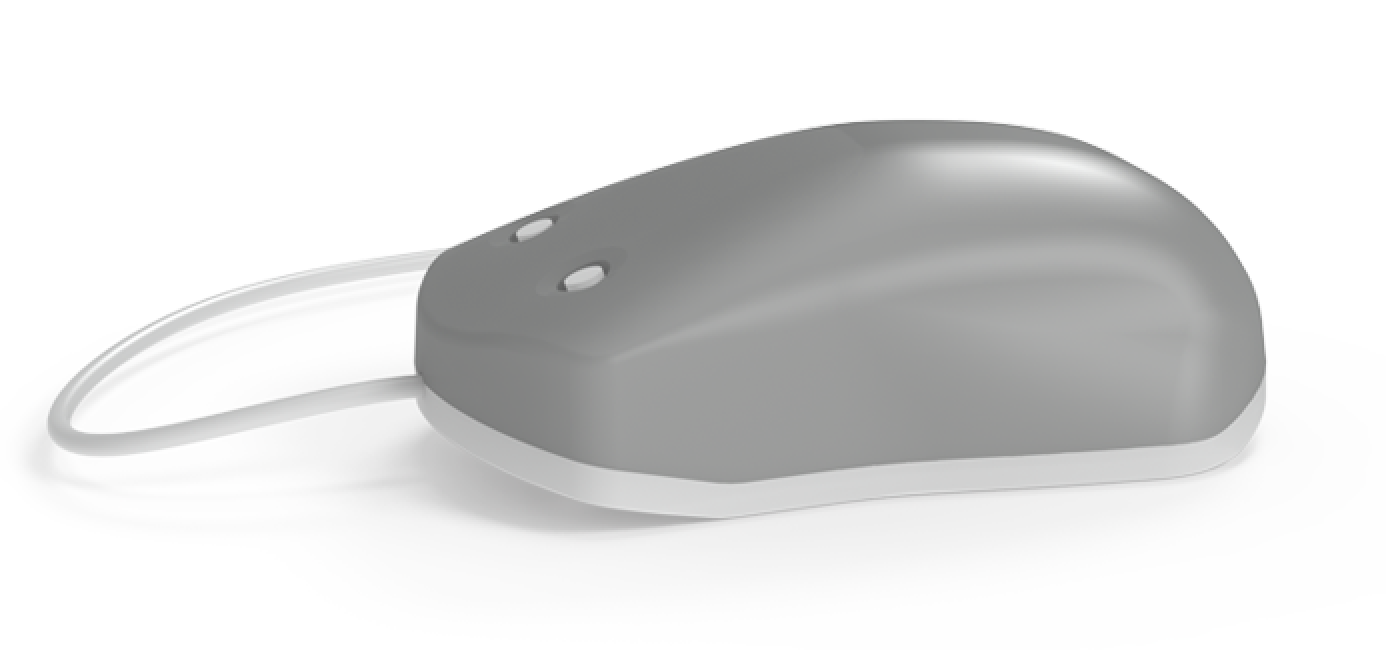
- The Brain Gauge Pro. The probes of this device not only deliver stimuli but double as response devices and the device also self-calibrates. Over 3.2 million lines of code are embedded in the Brain Gauge app which performs data collection, archiving and analysis.
3.2 History of the Science
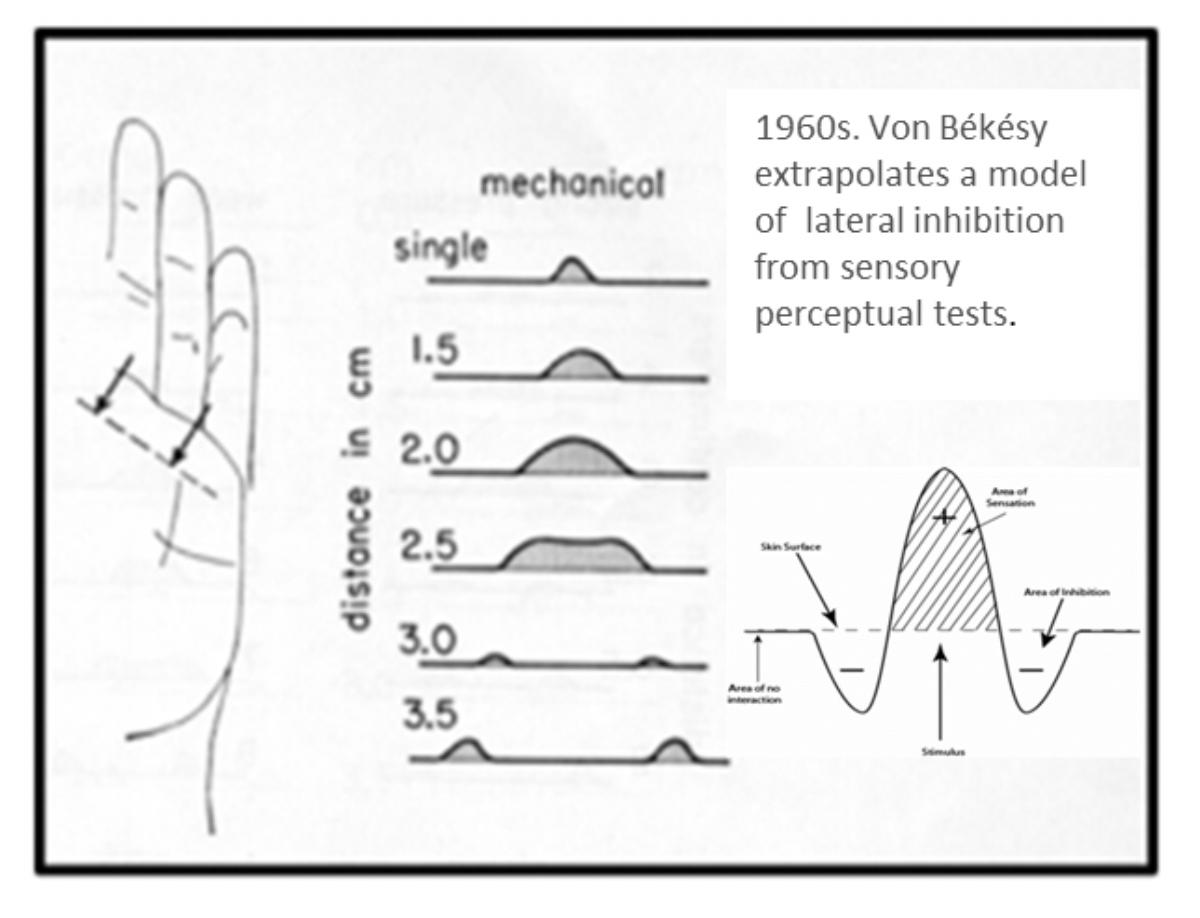
- Nobel Prize winner Georg Von Bekesy identifies a significant mechanism of CNS information processing via sensory perceptual tests. Lateral inhibition is predicted to modulate information that projects to adjacent and near-adjacent areas in the brain.
Lateral inhibition, in its simplest form, means that when you stimulate two fingers, two places in the brain that are beside each other “fight” with each other. This “fight” , or integration of information, is what determines what you feel on your fingers.
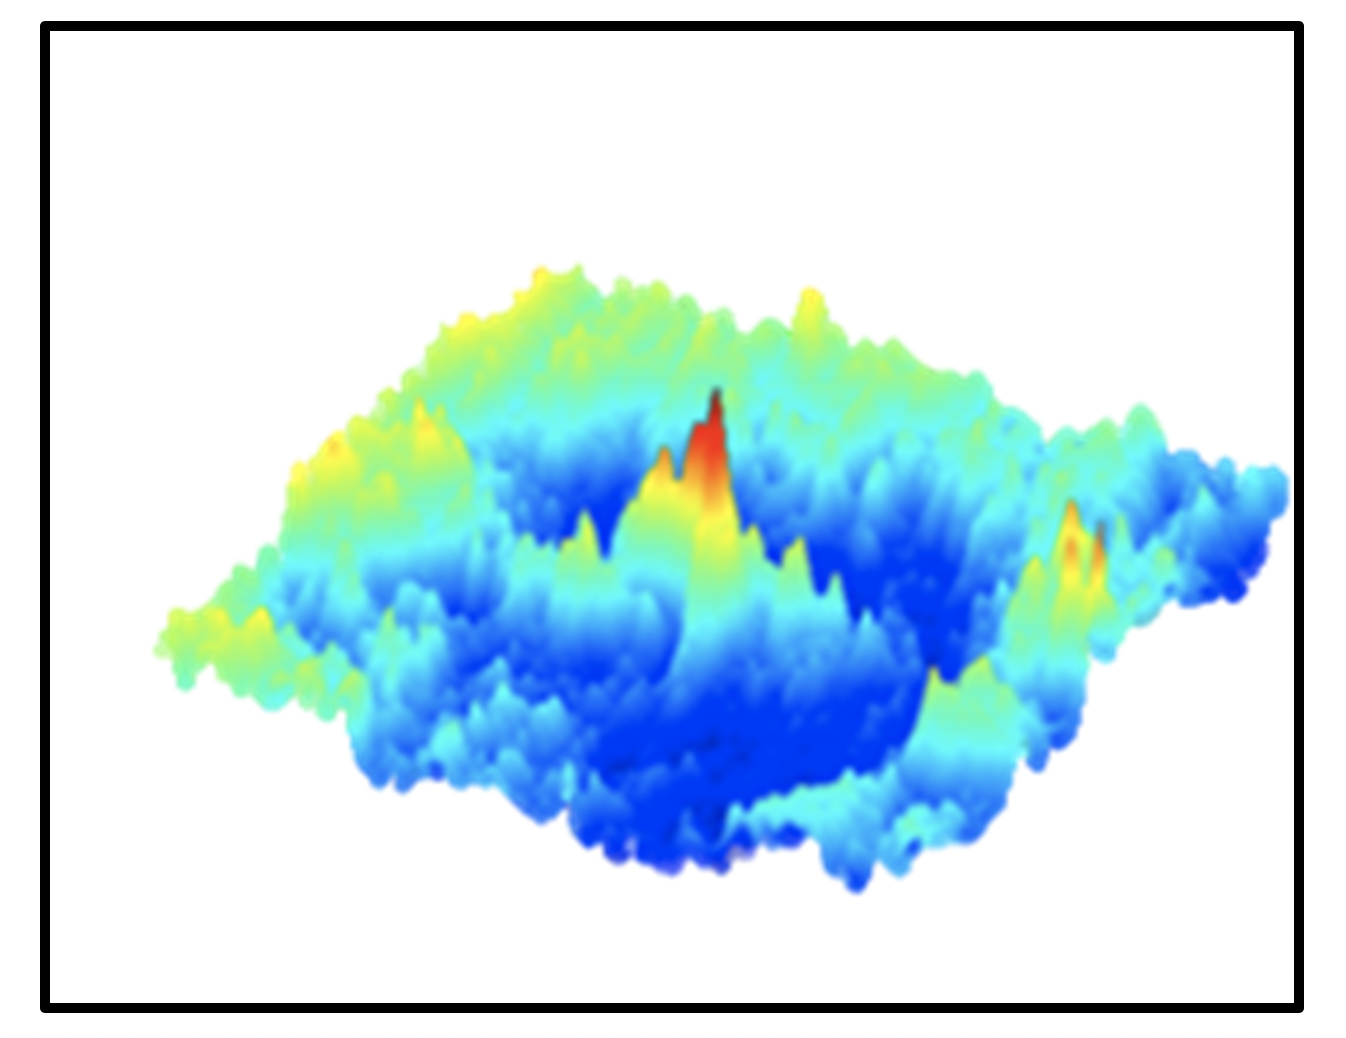
- High resolution imaging studies demonstrate prominent and robust patterns of lateral inhibition form in the cerebral cortex with tactile stimulation. Additional studies show that these same patterns of brain activity are altered with pharmacological and traumatic insult.
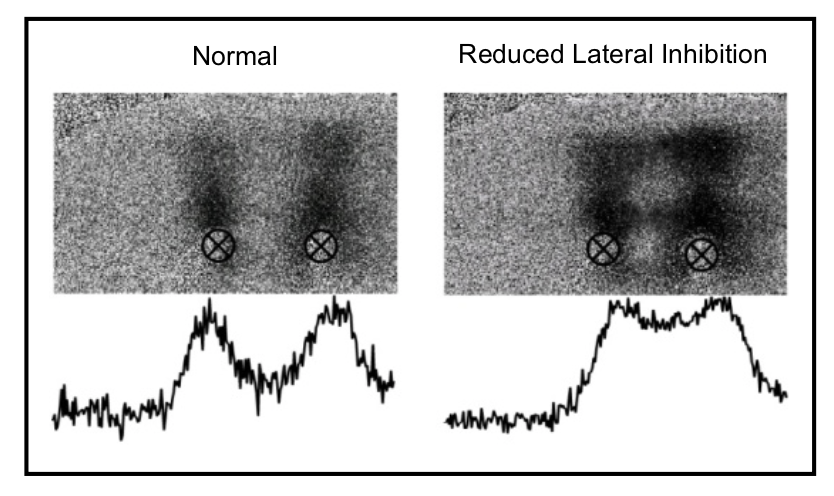
- High resolution imaging studies demonstrate that small changes in the efficacy of lateral inhibition result in large changes in brain activity patterns. These studies predict that sensory percept will be altered significantly with subtle changes in the CNS.
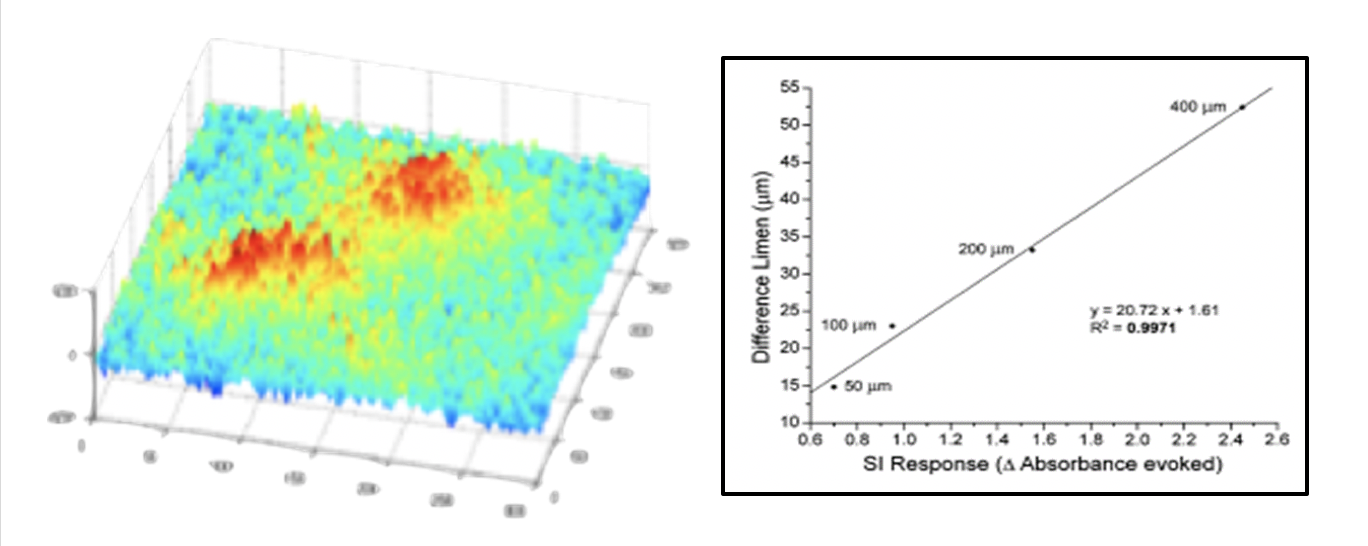
- Development of cortical metrics – sensory based perceptual measures that were designed from observations of dynamic cortical-cortical interactions from neurophysiological studies. Comparison of results from cortical metrics studies to neurophysiological studies yielded 98% or better correlations.
At left: stimulus evoked responses from imaging studies (10 micron resolution). At right: Correlation between responses observed in imaging studies vs. cortical metrics. You can read more about this in Francisco et al, 2008.
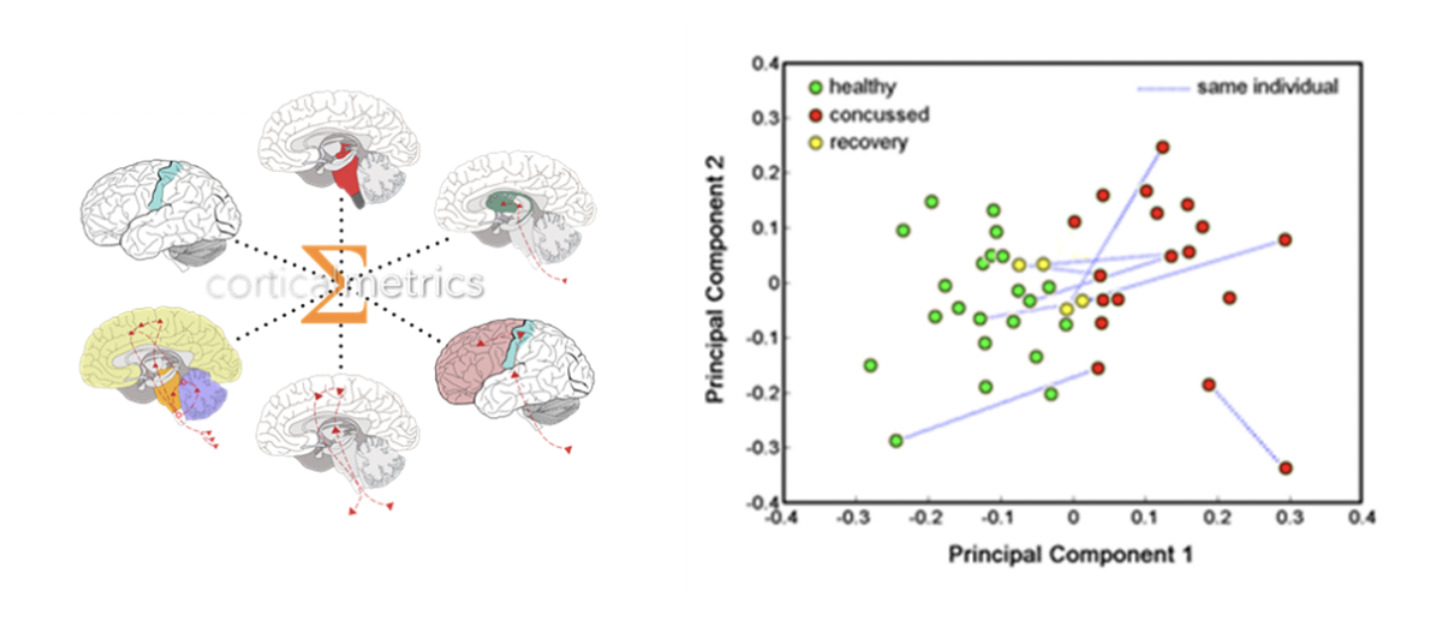
- Combining multiple cortical metrics – with each cortical metric targeting a different mechanism or pathway – yielded 99% confidence levels in differentiating concussed from non-concussed individuals using principle component analysis (PCA). Similar success was subsequently achieved with other neurological populations: migraine, autism, alcoholism, non-headache pain and diabetes, to name a few.
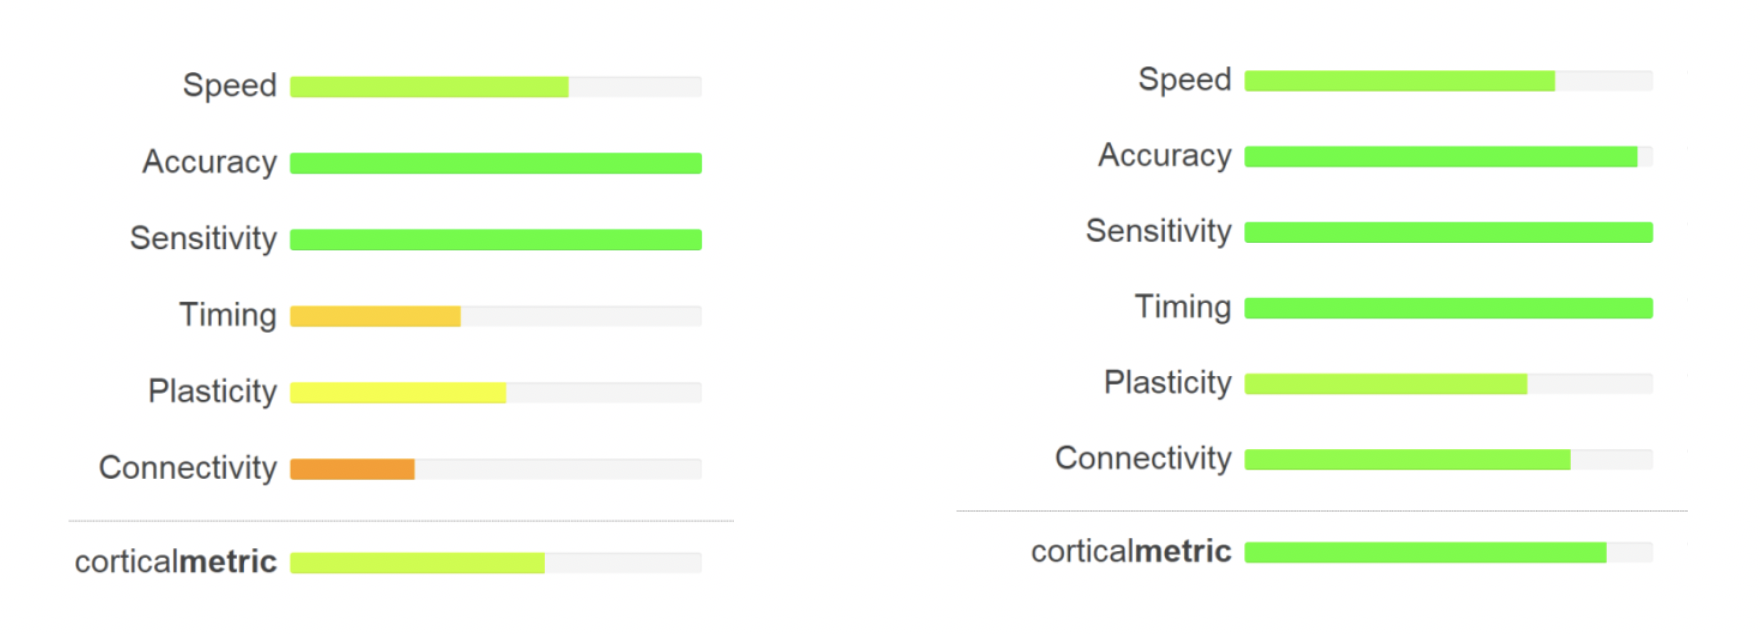
- Implementation of easy-to-read results. Bar graphs below compare individual 2 days post-concussion vs. 8 days post-concussion. Note that graphs intuitively reflect the recovery of the individual from concussion.
- Today, the Brain Gauge methods are deployed around the world at many clinical and institutional research sites. There are over 80 publications to date (most can be found here) and it is one of the few (if there are any) cognitive assessment tools that can correlate with the underlying neurophysiology that relates to the assessment.