Brain Gauge data from treatment of one of Dr. Phil Schalow’s patients with pre-Parkinson’s
condition.
We’ve been busy getting ready to launch the Brain Gauge, but meanwhile, there's lots of great news from our users of the Brain Gauge Pro to report on……we’ll do our best to catch up by having several newsletters in the next few weeks.
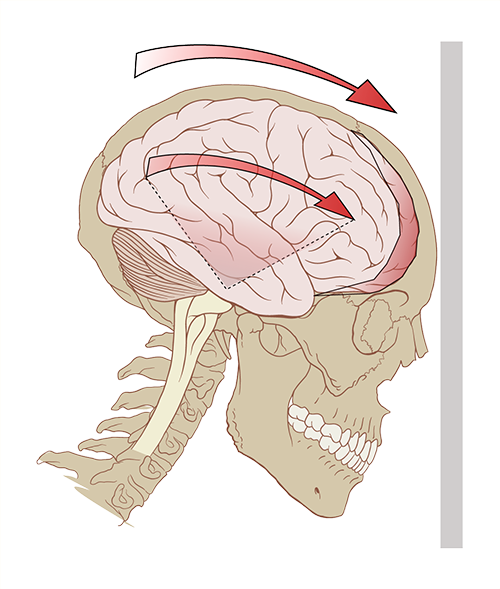
In the last post, we highlighted Timing Perception and told you which scientific findings related to it. In brief, a simple measure of timing perception (or duration discrimination) is obtained when an individual feels two pulses sequentially on their fingertips and then indicates which of the two felt longer. In the previous issue, we described how this metric has been related to cerebellar function (or dysfunction). Insult to the cerebellum results in poor timing perception, the case studies below highlight this finding.
Dr. Phil Schalow reports good success with treating patients who present with Parkinson-like symptoms. Two case studies are presented below. In one case, the patient was diagnosed with pre-Parkinson’s and in the second case, the patient showed a cerebellar deficit. Note that timing perception is poor for both individuals before treatment and significantly improves after treatment.
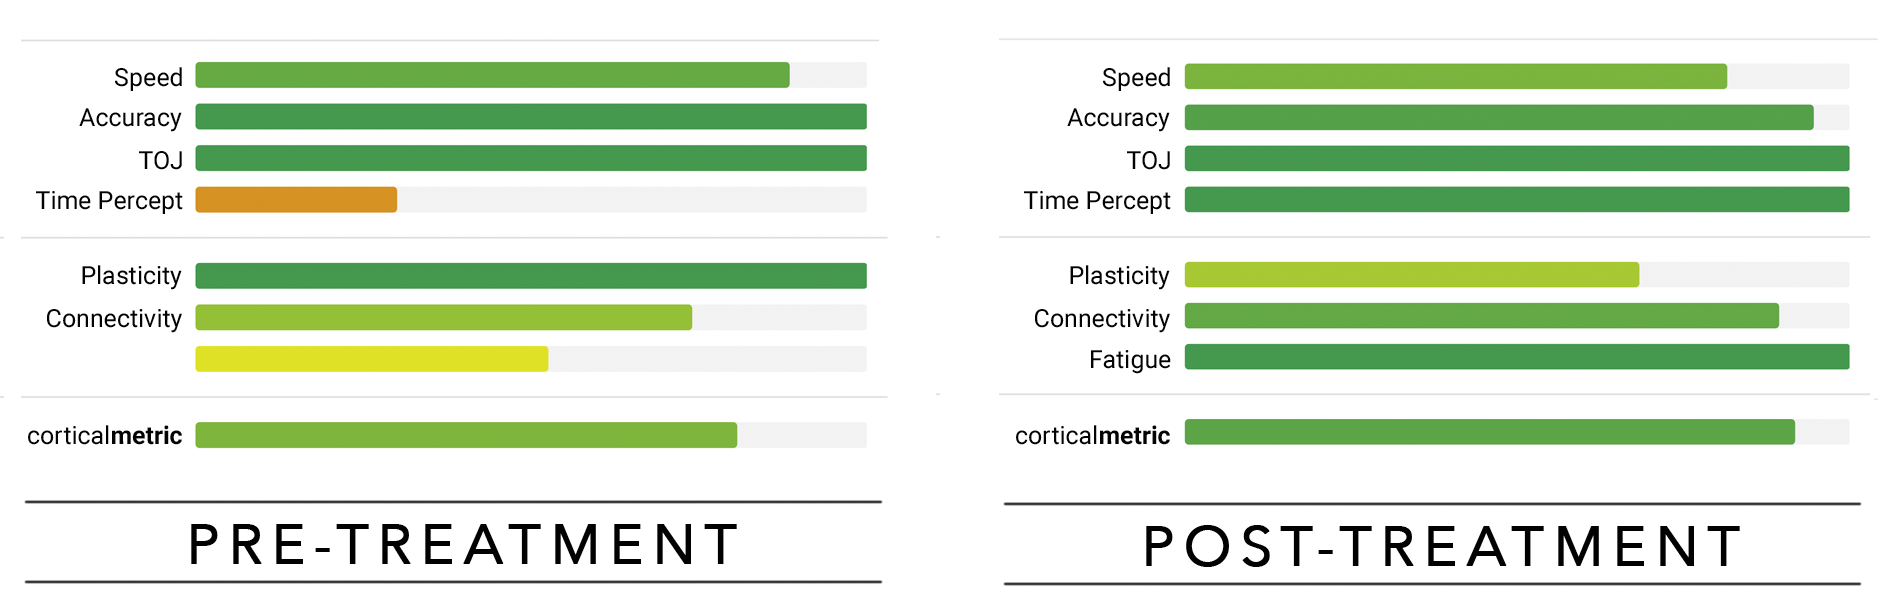
The first subject (above) was diagnosed with pre-Parkinsons. Dr. Schalow’s treatment consisted of NUCCA as well as being under nutritional protocols outside the office. The treatment had a positive effect on corticalmetrics (compare chart on the left to chart on the right).
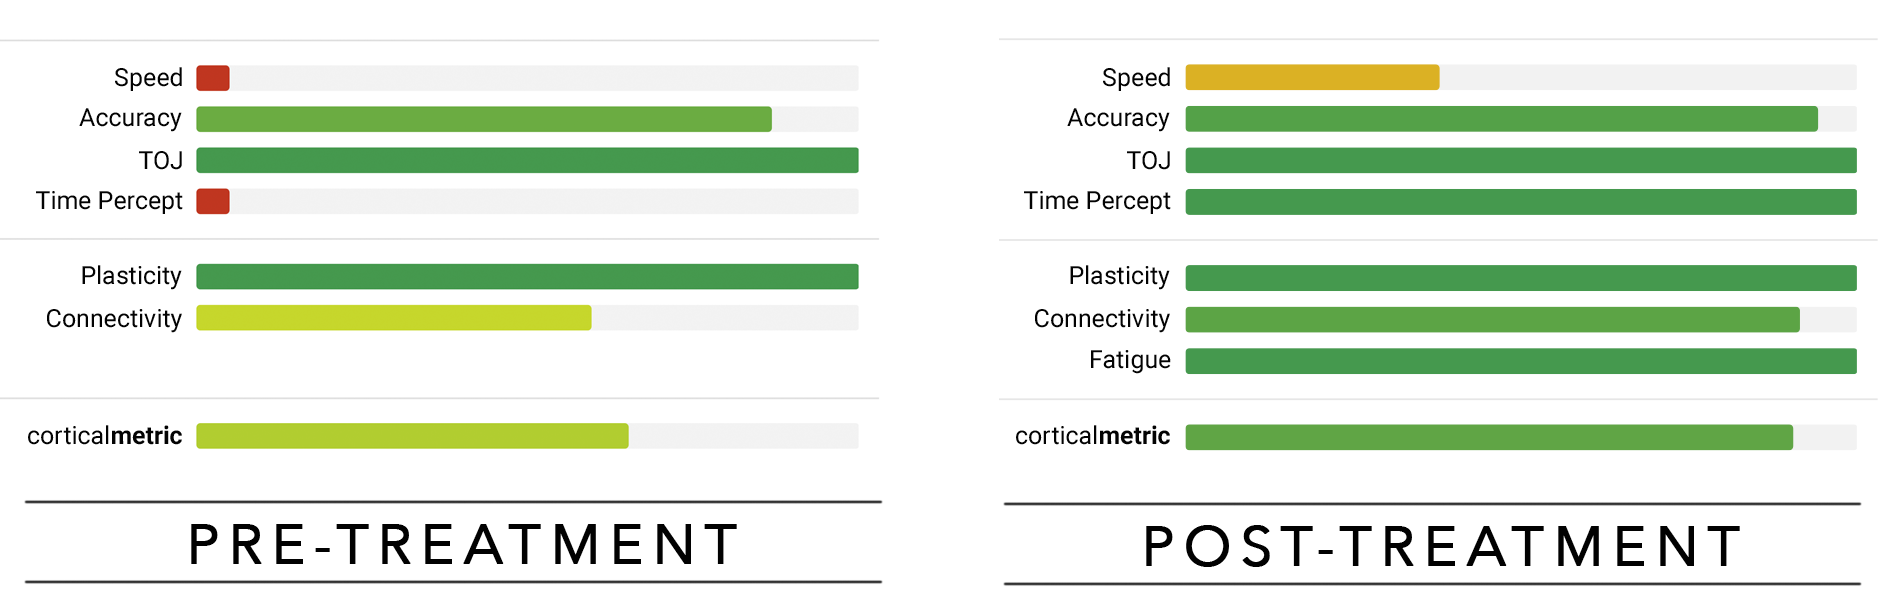
The second subject (above) had neurodegenerative signs of slow speech and confused words. He was a heavy smoker and on statin drugs when he started treatment. An eye exam indicated a cerebellar deficit. He stopped taking statin drugs, reduced smoking to four cigarettes a day and was under NUCCA care. To date, he has been holding his correction for two months
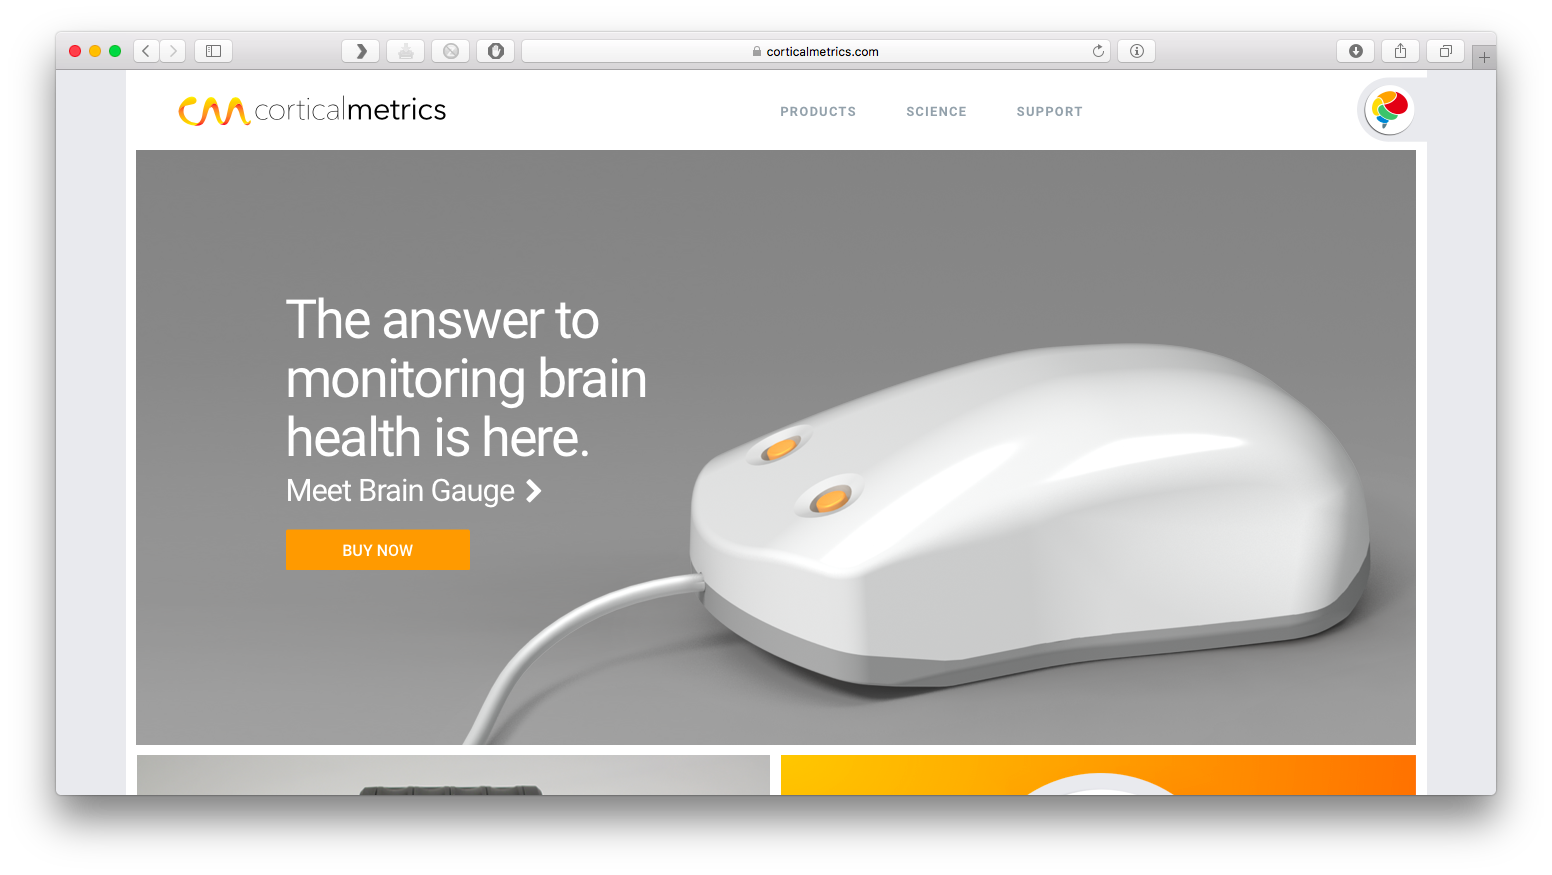
Our website just got a facelift!
Our website at corticalmetrics.com now has a dedicated support section to answer all of your questions about how to use Brain Gauge. Feel free to explore the science behind Brain Gauge and gain a greater understanding of the neural mechanics that make Brain Gauge possible.
Interested in trying a new test?
Periodically we will develop a new test. Let us know if you’d like to try it out. Today’s new protocol is a tactile memory test. If you are familiar with Simple Simon, it’s very similar. The test delivers a sequence of stimuli to the fingertips (e.g., L-R-L) and the responder has to repeat the sequence. Each time the sequence is repeated correctly, the subsequent sequence gets longer. Longest sequence anyone as achieved to date is 12 but the average is 8. Email us atHighlighted study: Concussion
Cortical Metrics is being sponsored by the Office of Naval Research to conduct concussion studies and improve Brain Gauge technology. The end goal is to develop standardized metrics of concussion so that commanders in the field can better assess the impact of a blast injury on a warfighter. We’re not there yet (no one else is close!), but we do collect lots of interesting data and thought our readers would be interested in some of the case studies. Currently, we are collecting concussion data at 50+ sites from college sports programs, individual athletic teams (both semi-professional and professional), civilian clinics, university based research sites and military based studies. The data from all of these sites is used to analyze, validate and calibrate cortical metrics so that we will be able to accurately assess head injuries.
How accurately have we been able to differentiate concussed from non-concussed individuals?
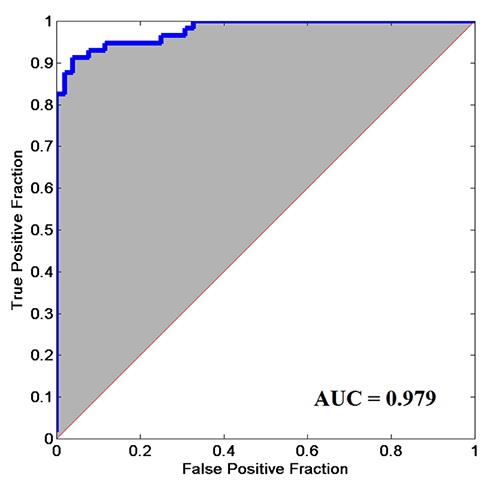
In one study we analyzed the data by plotting an ROC curve (pictured above) with the subjects overall cortical metrics score (derived from 7 tests; data from 52 concussed individuals). The ROC is one of the standard methods for determining how viable a technique is. If the area under the curve (AUC) is 0.50, then it means the method is equal to chance. Methods of 0.80 or above are considered very good. Our ROC plot had an AUC of 0.98. To date, we know of any other method that has demonstrated this amount of reliability for differentiating concussed from non-concussed The data most of you are familiar with graphs of each of the individual tests that go into the plot below. It is the composite of all the scores that is most sensitive to the individual’s brain health, and this is what we are currently working on making easier to interpret for our end users.
Special thanks to Brian Wheeler and Beth Hayford at Davidson College for helping with this study. Davidson College was the first program to participate in our concussion research, and without their help, we’d probably wouldn't even have a newsletter! In the upcoming issues we’ll describe some of our case studies in concussion.