If you are a Brain Gauge user, you've probably noticed the overall corticalmetric score. This comprehensive measure is calculated from all the tests that were taken in a single test session. If that is a sufficint explanation, then read no further.
When we first started developing cortical metrics – all the different measures collected by the Brain Gauge (and also the name of the company... we realize that can be confusing!) – we wanted to create a unique metric that could summarize the brain profile of each individual. We believe that it takes multiple measures to accurately assess brain health; no single test could describe a person's entire range of cognitive functions. For example, if you go to a clinic and say that you have a headache, the physician will not immediately suggest a remedy or just write you a prescription (at least we would hope that is not the case!). Before a treatment protocol can be established, you would be asked about to desribe specific symptoms and when they started and how long they last and what your sleep habits are and what if anything has changed in your life and about three dozen other questions that probably won't do your headache much good (at least not at that time). Your responses help the doctor narrow down the possible causes of your headache, allowing them to create a treatment plan that will target the underlying mechanism.
We take the same approach when designing with tests to be delivered by the Brain Gauge. Each Brain Gauge test targets a different mechanism of information processing. From looking at your scores from every test, we develop a "brain health profile" - consisting of your corticalmetrics scores like Speed, Fatigue, and Plasticity - that gives clinicians an idea of where to begin searching for things that could be affecting your brain health.
We collect a variety of measures in a single test session, and then we convert those measures into your overall corticalmetric. For the sake of simplicity, we’ll do an example without too many data points.
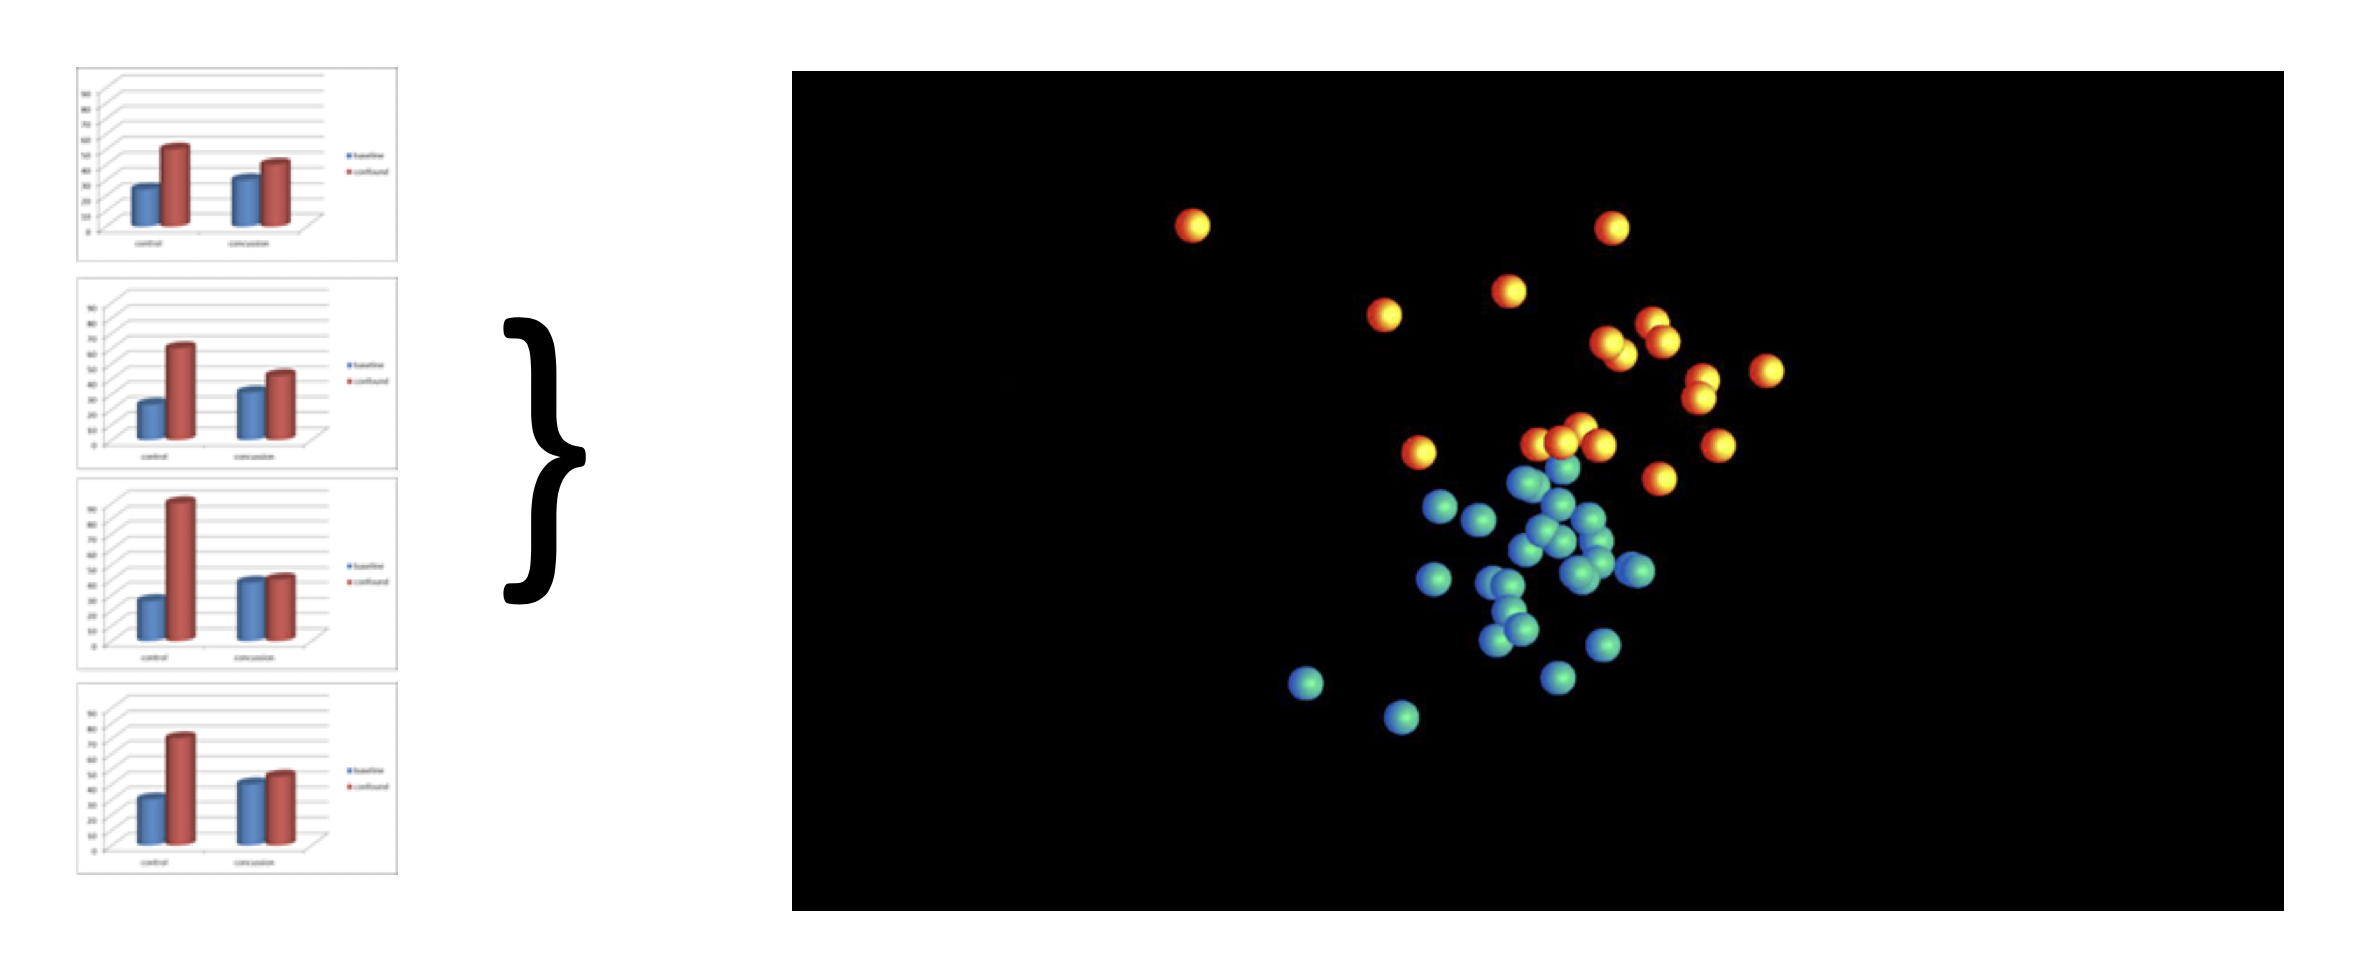
First, we combine all n-measures into an n-dimensional space; if there are 6 measures, then we plot the data into a vector with 6 coordinates. Each data point has a particular magnitude and direction. We then apply a technique known as principle component analysis (PCA), which shows us the scores that have the greatest effect on your corticalmetric. When we plot that data healthy controls tend to cluster in the center while non-healthy individuals shift to different locations. The plot above shows a 2D rendition of an 8-dimensional dataset.
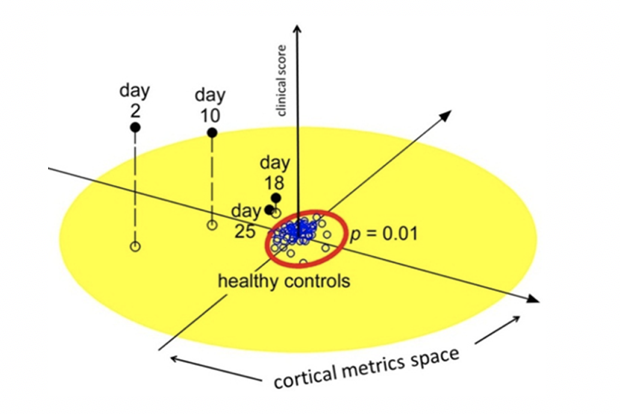
Now let’s examine how a concussed individual compares to healthy controls in just 2 dimensions of the corticalmetrics space. The graph below plots the multi-dimension corticalmetric on the x-y axes and the clinical severity score (the number of concussive symptoms) on the z-axis. Note that healthy controls cluster around the center point while concussed individuals (points labeled with #-days post-concussion) move closer to the center as they recover from concussion.
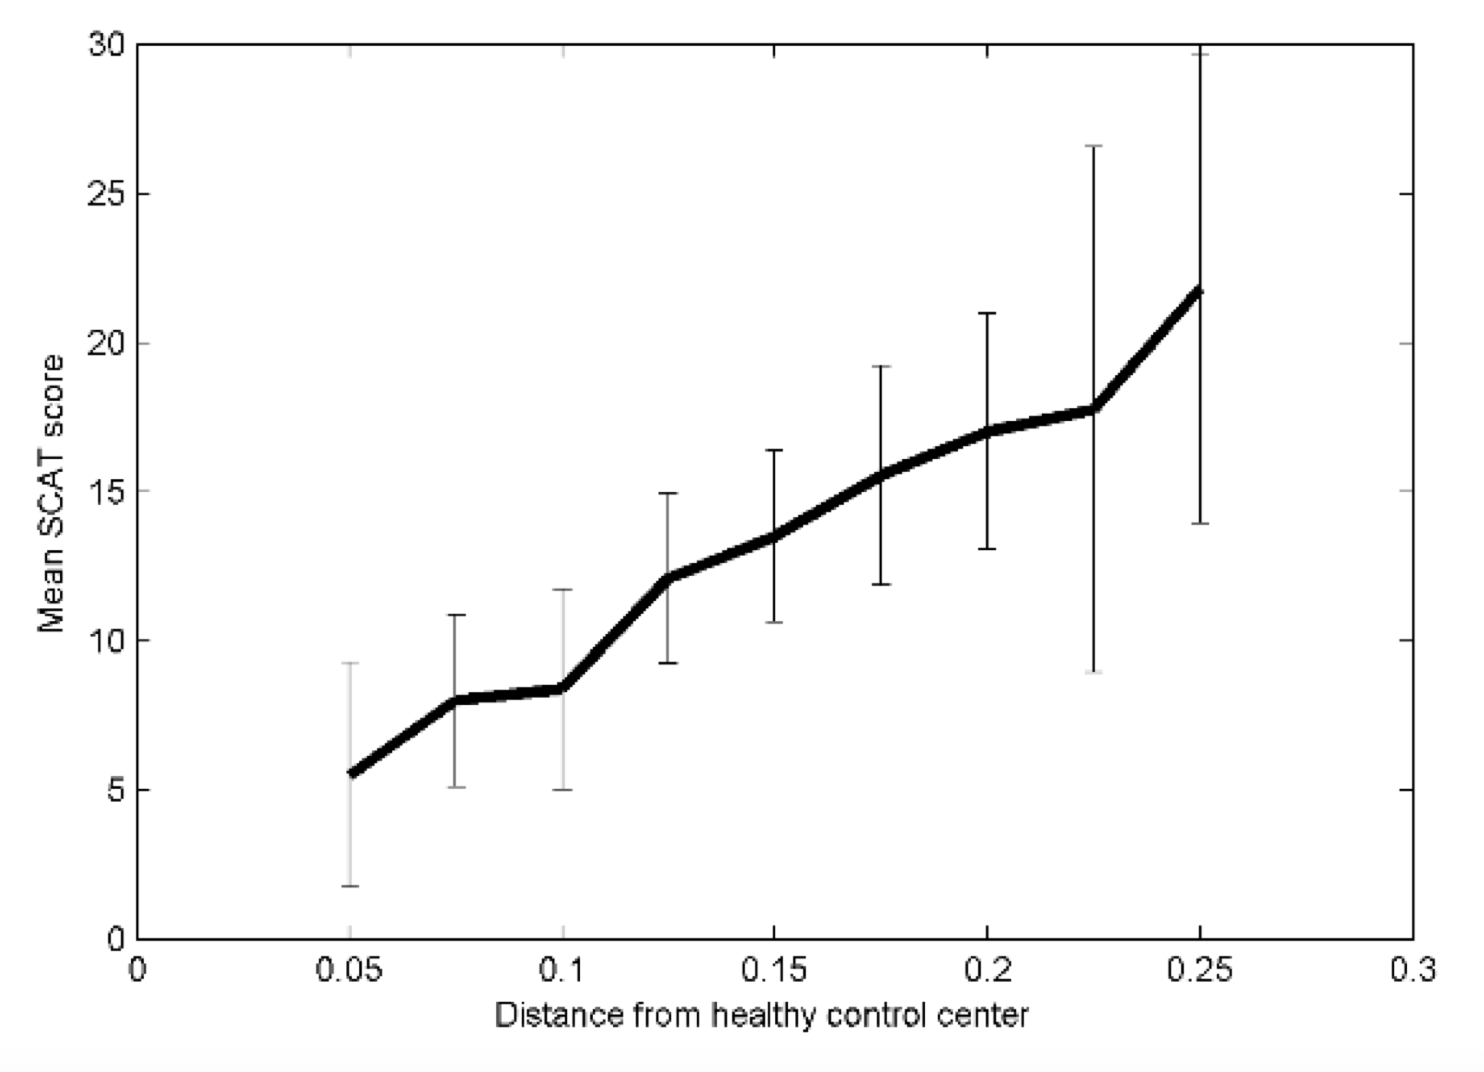
If we look at multiple individuals in this study and just look at distance from the center, corticalmetric scores correlate very well with the number of concussive symptoms.
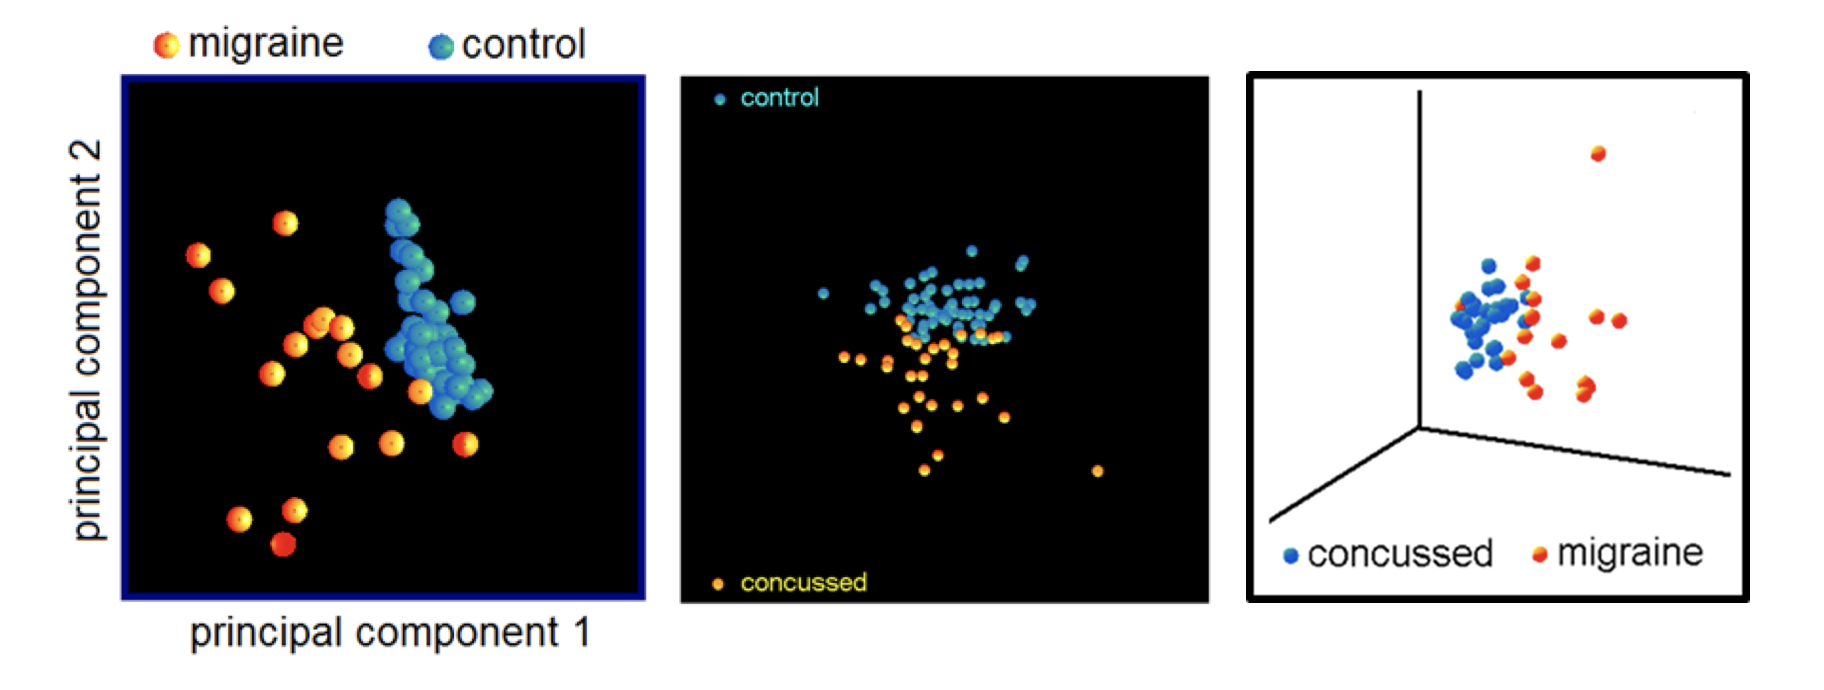
The distance described above is equivalent to your corticalmetric score from each Brain Gauge test session. However, if you shorten the battery by only taking one or two of the tests (which is perfectly fine to do – there are lots of good reasons for taking that approach), it just reports the average for those select tests. Those measures cannot be compared accurately to a corticalmetric that is collected from all eight of our measures. One advantage of the method for research purposes is that implementation of the multi-dimensional method allows you to compare different populations. Note that when you use the full implementation of the method mathematically, different populations separate by orientation, not just distance. Note the plots below that show the differences between people with migraine vs. controls, people with concussion vs. controls and migraine vs. concussion. We don’t expect anyone to try to figure out if their headache is from getting concussed or some other neurological reason, but it is an area of research that will be interesting to pursue.